Guides and reports
Building our data science platform with Spark and Jupyter
By Serge Smertin, Stream Lead Monitoring & Data Warehousing, Adyen

Optimizing payments transactionsby a few basis points can result in revenue uplift in the millionsfor many Adyen customers.
Recently we worked to enhance our data science platform and improve the velocity of data insights we could provide. While we wanted a setup that would provide as much flexibility as leading cloud solutions, our security requirements mandate that all our solutions are hosted on premise.
With popular solutions such as Amazon EMR or Google BigQuery a no-go from the beginning, we had to get a little creative to build an on-premise stack that provided the flexibility we needed.
Data analysis with Looker and RStudio
Adyen’s live payments platform is clustered across several regions and multiple data centers, and data is consolidated to a single PostgreSQL reporting cluster. Our initial approach in data analysis was to take snapshots of this data into another Postgres DB to analyze.
As an RDBMS, Postgres is great for transactional processing, but is not designed for clustering and other large scale analysis required by ML. Therefore, we would take snapshots of this data into another database for analysis.
We would use these data snapshots to create simple, shareable analysis and dashboards usingLooker. For more advanced data analysis, we primarily relied onRStudio. This was a problem, as there was little consistency — the company’s standard library for data analysis was a sparse collection of SQL queries with some duplicate functionality and a relatively low level of standardization. Data analysis was exclusively done on precomputed aggregates, as it was not performant enough to work with per-event data.
In addition, most of our data analysts use scripting languages such as R and Python, which haverich ecosystems of data analysis and ML libraries. Our data analysts would make a request for new data, or aggregating new datasets, which required a database modification. At the time, all database modifications were deployed monthly. This meant any data requirement took at least a month.
Choosing new infrastructure
Our goals in moving to a new platform were to a) reduce our waiting time for aggregate data from a month down to minutes, and b) adopt a framework that could handle semi-structured and structured events. We also wanted to get our MVP live in under a month.
The first step was to decouple our new ML platform from our payment processing platformour payment processing platform. Our main drivers in deciding a framework were to:
- Perform fast ad-hoc aggregations that could be parallelized onto a cluster of machines.
- Support scripting languages connected to the ML ecosystem.
- Switch from pre-aggregated data to aggregated on demand (to support semi-structured events).
Potential solutions
As we were familiar with R, we tried to get a bigger server using the snapshots, with RStudio Server as the interface. However, several issues — vendor lock-in, a lack of decent support of parallel processing, and any languages other than R — made this impractical.
We looked at BigSQL projects like CitusDB, Facebook’s Prestodb, Apache Hive, and others. While these could scale the business intelligence, they didn’t provide enough flexibility for interactive data analysis beyond vendor-specific flavors of SQL. It was not suitable for unstructured events like logs and complex JSON graphs.
Another option was a vanilla Hadoop setup with MapReduce applications. However, this would have required a tremendous amount of code and maintenance to make it work coherently. We had familiarity with Hadoop and we planned to work with it eventually, but in the first iterations we chose to not use it so we could get our MVP out as soon as possible.
The winner: Apache Spark
Ultimately, we settled on Apache Spark. At the time we began the project, it was becoming quite hyped in the big data ecosystem, and a key point of attraction was that it could simplify the complexities of traditional MapReduce applications by minimizing the amount of code required to be written. The other reasons to adopt this solution included:
- It’s as easy to work with structured data in DataFrames, as with unstructured in RDDs.
- It has decent support for persistence by using Parquet as simple and fast columnar data storage format.
- It has built-in support for ML and its community is actively working on having it improved.
- If used in a right way, it works fast with both Scala/Java and Python/R scripting languages, so we thought it’s easier to let it be used along with the data science tooling people are already used to.
- The same code can be reused for both batch and streaming processing models. Streaming performance down to millisecond level was not a hard requirement, so we made a trade-off for the sake of reducing complexity.
- It came with decent interactive shell application, which is pretty easy to use for ad-hoc requests.
All these reasons combined made it a compelling choice for us. And based on our experience I’d go so far as to say that if you want to begin your own big data and ML initiative from scratch, I recommend starting with Apache Spark.
Notebook infrastructure

Desired setup
After deciding our backend infrastructure, we needed to pick the interface. Our preferred approach was managed notebook interface environments, to which we could add customizations and harden from a security perspective. Specifically, we needed an on-premise solution (due to our above-mentioned security requirements) that would allow exhaustive in-depth auditing. We needed to track full data usage and lineage to explain how a specific chart or table was generated and which data each ML algorithm was using.
A default way of working with Apache Spark is to launch an interactive shell from the terminal. However, this makes it very hard to present information. We wanted to go beyond that and make data analysis more shareable and reusable.
We looked at options includingZeppelin,Cloudera Hue,Databricks, andSpark Notebook. But we ruled them out either due to them not allowing on-premise management or disliking how they managed the notebook infrastructure.
Winner: Jupyter
We choseJupyteras it offers amulti-tenantenvironment that supports all the analysis languages we use within Adyen, and has the right level of maturity for our internal purposes.
In choosing a kernel (Jupyter’s term for language-specific execution backends), we looked at ApacheLivyand ApacheToree. Livy had problems with auto-completion for Python and R, and Zeppelin had a similar problem. And with Toree, the integration was not quite stable enough at that time. Ultimately, we built our own forks of Python and R kernels, as this makes it easier to maintain security and meet traceability requirements.
Security through auditing
Given the vast flexibility of this kind of tooling, we need to pay special attention to table and column-level data lineage and auditing. This is required for auditing for security and support cases, as well as being able to explain how the ML model was created back in time. This approach would allow us to independently update the ecosystem, without worrying too much about intercepted code flows.
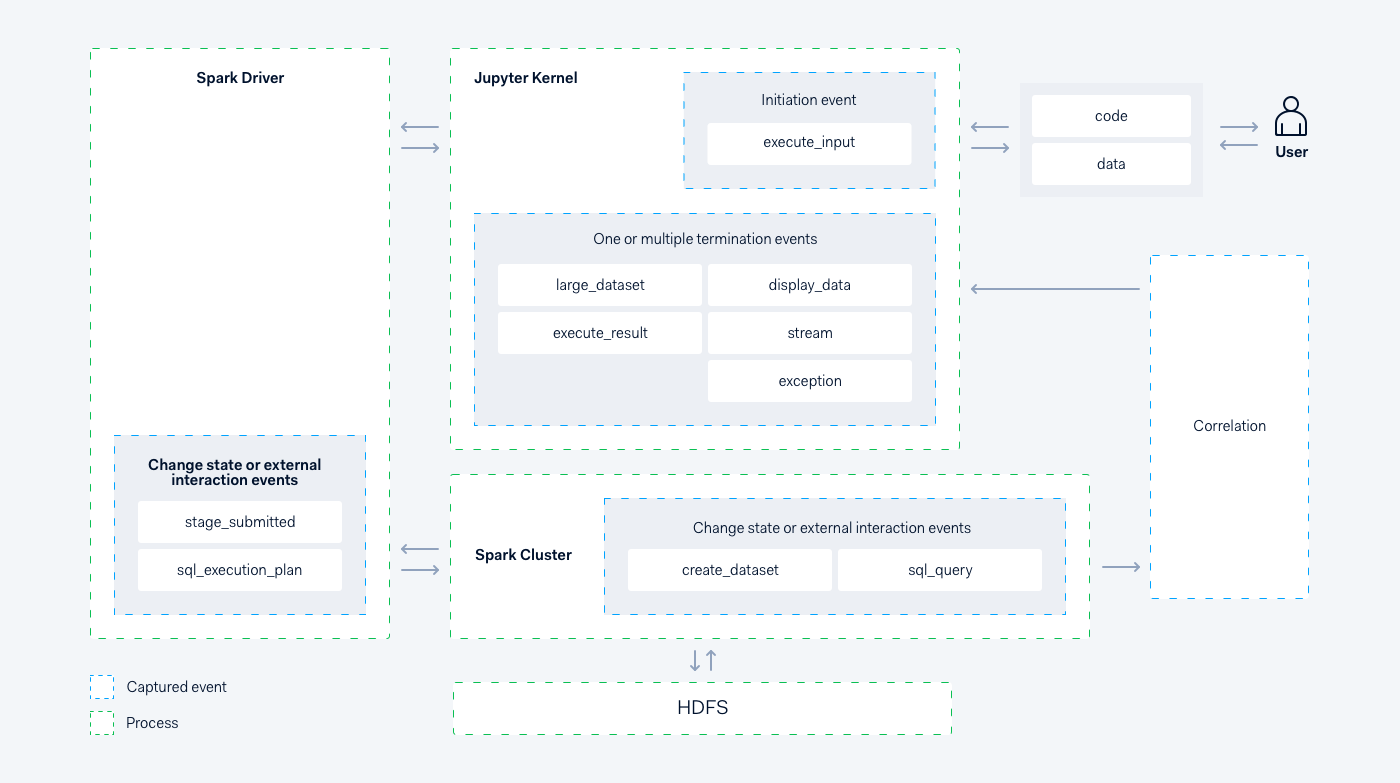
We added instrumentation across all levels of data analysis workflows — from looking when users looked in and which notebooks were opened to linking the code entered in notebooks with actual files created and accessed on HDFS. Most of the work was related to creating a specific fork of Jupyter protocol client library and making custom Java agent for drivers and executor jobs. This allowed us to create custom events we track for auditing.
This diagram shows a snippet of some of the events we track:
Our data science platform
Testing while documenting
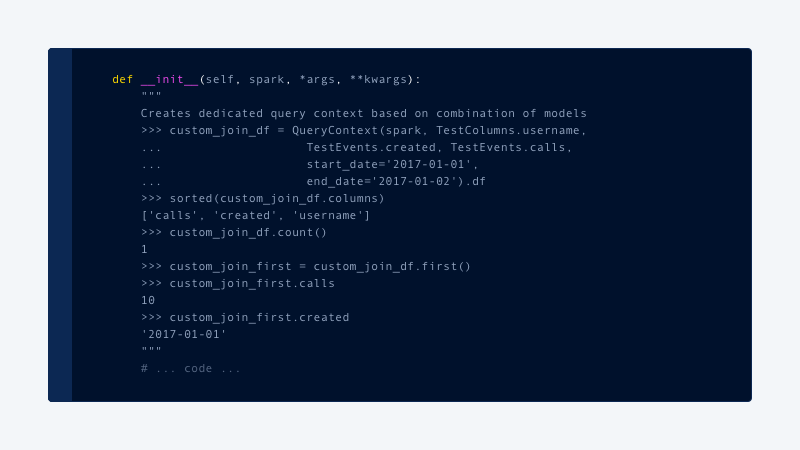
All critical paths of the code are covered with Integration Tests usingPython Doctestframework, enabling up-to-date and accurate usage documentation for each team that uses the data science platform. The tests allow us to have the following style of documentation, which is validated daily:
Spark and Jupyter: working together
Spark is commonly used in the cloud. And in cloud-based deployments, it is relatively easy for data scientists to spin up clusters for their individual needs. But since we were on premise, we were working with a single shared cluster, meaning it would take a relatively long time to add new servers to our data center.
Therefore, we had to optimize for as many concurrent analyses as possible to run on the existing hardware. To achieve this, we had to apply very specific configurations, and then optimize these configurations to suit our own situation.
Executor cores and caching
Initially we allocated a static number (5–10) of executor cores to each notebook . This worked well, until the number of people using the platform doubled. Dynamic allocation turned out to be pretty handy, as notebooks were not 100% busy with doing computation and really required different amounts of executor cores depending on what they were doing:
spark.dynamicAllocation.enabled=true
spark.dynamicAllocation.maxExecutors=7
spark.dynamicAllocation.minExecutors=1
This worked well for a period of time, until people actively started caching their dataframes. This means the dataframes are stored in the memory of the executor. By default, executors with cached data are not subject to deallocation, so each notebook would effectively stay at their maxExecutors, rendering dynamic (de)allocation useless. At that time this option was under-documented. After trial and error we figured out that within our organization, five minutes of inactivity is the most optimal period to shut off access to compute resources:
spark.dynamicAllocation.cachedExecutorIdleTimeout=5m
Killer chatbot
Initially our idea was that each data scientist would stop their notebooks/drivers to release resources back to cluster. In practice, however, people sometimes forget or delayed this. Since human-based processes don’t work optimally in this kind of situation, we implemented a kill script that runs at regular intervals to notify data scientists, via chatbot, that their notebooks were forcefully shut down due to 30 minutes of inactivity:

Broadcast join
A significant performance benefit came from increasing the value of:
spark.sql.autoBroadcastJoinThreshold=256m
This helped optimize large joinsThis helped optimize large joins, from the default of 10MB to 256MB. In fact, we started to see performance increases between 200% to 700%, depending on amount of joined partitions and type of the query.
The optimal value of this setting can be determined by caching and counting a dataframe and then checking the value in the “Storage” tab within the Spark UI. The best practice is also to force broadcasts of small-enough dataframes with sizes up to few hundred megabytes within the code as well:
df.join(broadcast(df2), df.id == df2.id)
The other settings that helped our multi-tenant setup were:
# we had to tune for unstable networks and overloaded servers
spark.port.maxRetries=30
spark.network.timeout=500
spark.rpc.numRetries=10
# we sacrificed a bit of speed for the sake of data consistency
spark.speculation=false
Persistence
From a storage perspective, we selected the default columnar-based format, Apache Parquet, and partitioned it (mostly) by date. After a while, we also started bucketing certain datasets as second level partitioning. (Rule of thumb — use bucketing only if query performance cannot be optimized by picking the right data structure and using correct broadcasts.)
For the first few months we worked with simple date-partitioned directories containing parquet files. Then we switched to Hive Metastore provided byspark-thriftserverspark-thriftserver, giving us the ability to expose certain datasets to our business users through Looker.
Merge schema
In the beginning we treated our Parquet datasets as semi-structured and had:
spark.sql.parquet.mergeSchema=true
After six months we switched mergeSchema to false, as with schema-less flexibility there is a performance penalty upon cold notebook start. We wanted to finally migrate to a proper metastore.
Spoink — Lightweight Spark-focused data pipeline
In the beginning, data was created through notebooks, and scheduled in the background by cron. This was a temporary hack to get the ball rolling, but did not provide sufficient functionality for the long term.
For this, we needed a standardized tool that was simple, had an error recovery mode, supported specific order execution, and idempotent execution. Code footprint and quality assurance for our data pipelines were also key considerations.
So instead, we took the best concepts from existing tools — checkpointing, cross-dependent execution, and immutable data — and created our own orchestrator/scheduler, that worked primarily with single shared Spark cluster. We called it Spoink, in order to be“logical” and “consistent” with the big data ecosystem.
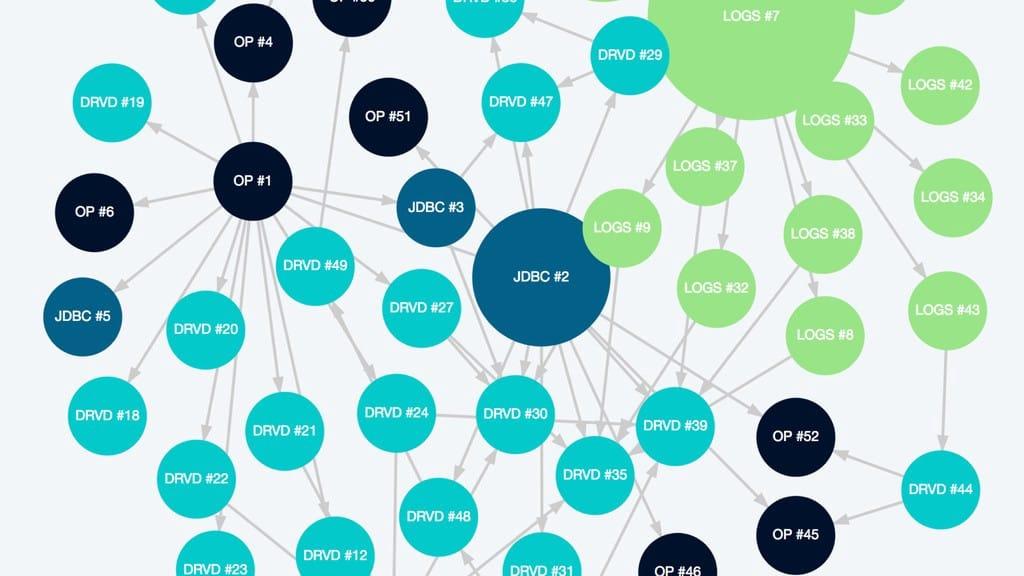
Within the Spoink framework, every table is called a DataSource. It requires a function to create a Spark dataframe and registration in specific scheduled interval. We are also required to specify which metastore table to be populated, and how data would be partitioned:

With this setup, it became very easy to develop and test ETL functionality within Jupyter notebooks with live data. It also meant we were able to repeat this process back in time just by invoking the same function for previous days.
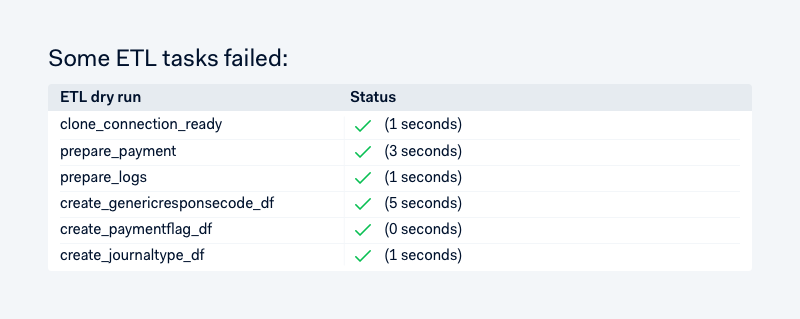
We have a few top-level types of data sources, like LogSource, PostgreSource and DerivedSource. The core data science platform team owns most of the log and postgres-based sources, and data scientists have almost full freedom to create and modify DerivedSources. We forced every datasource to bepure functions, which enables us to dry-run it multiple times per day and quickly see things that may break production ETL processing:
Data API
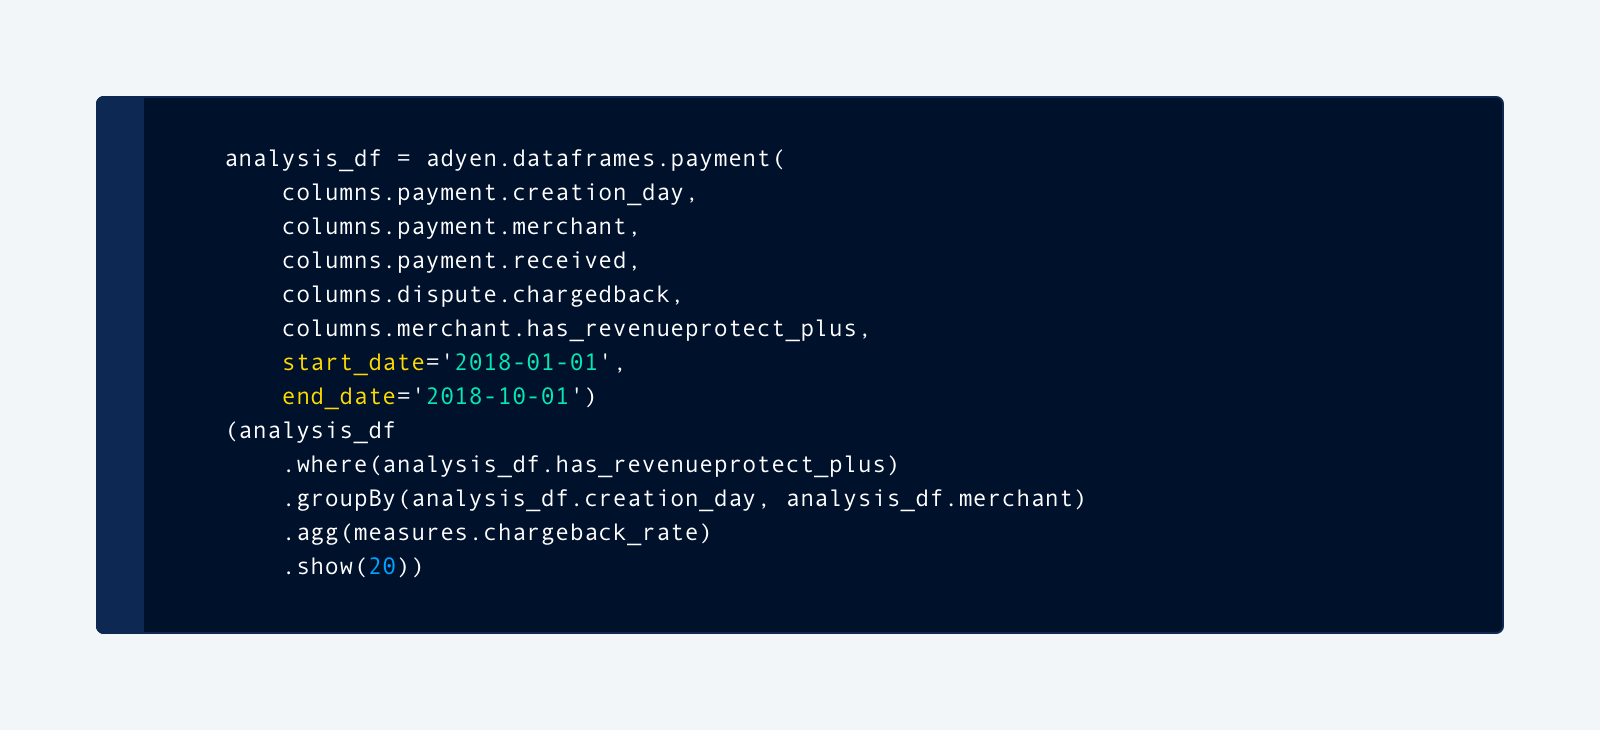
Every data team has its own structure and reusable components. In the pre-Spark era, we had a bunch of R scripts — basically a collection of SQL queries. This created some confusion in consistently computing business-important metrics such as payment authorization or chargeback rates.
Following a very positive experience with Looker view modeling, we were excited to have something like that for our ML: a place in code, where we define certain views on data, how it’s joined with other datasets, and metrics derived from it. This was preferable to hard-coding dataframes every time when needed, and having to know which tables and possible dimensions/measures exist.
Here’s an example that creates our interactive chargeback rate report (and hides the complexity of joining all the underlying sources):
Beta flow
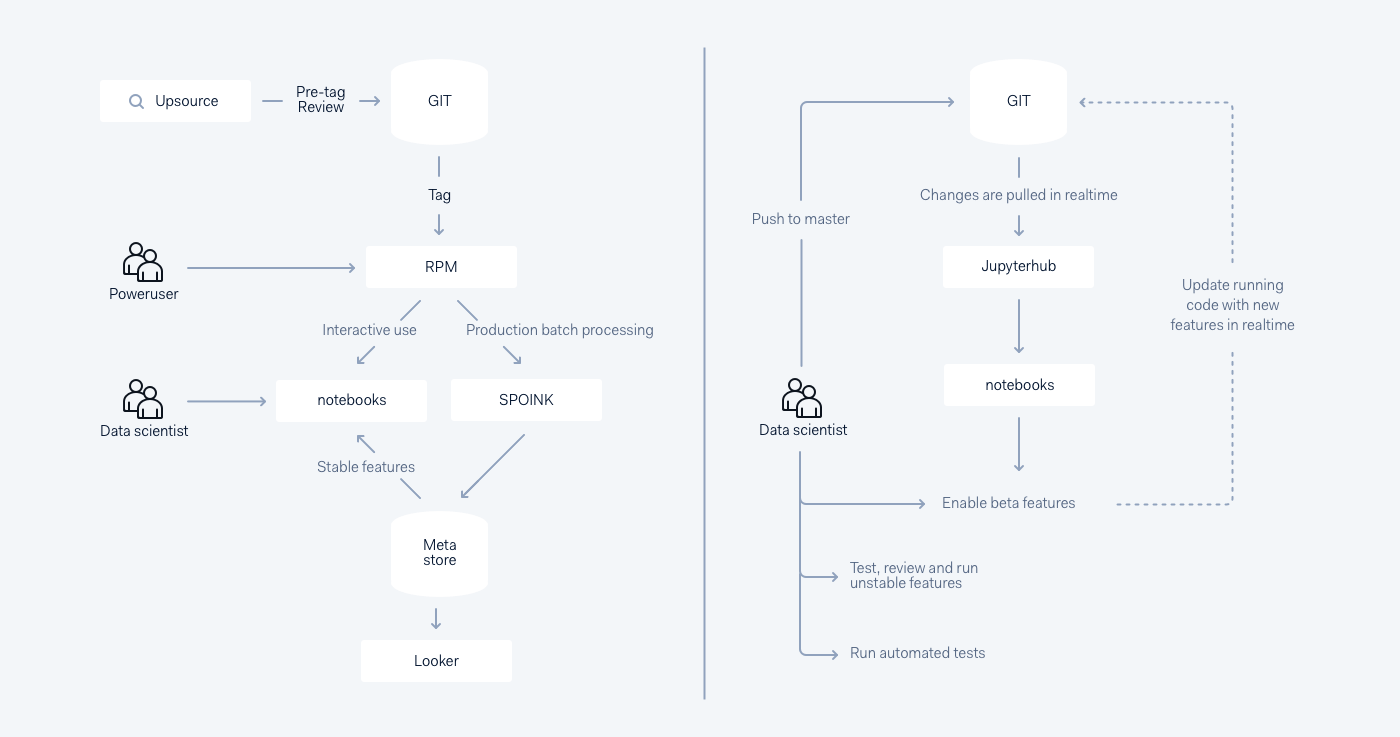
%adyen_beta (a.k.a. JRebel for Jupyter/Spark) gives tremendous benefits to the quality of Spark code and workflows in general. It allows us to update code in notebook runtime directly, by pushing to the Git master branch without restarting the notebook. Here’s how it works:
Release flow versus Beta flow
Conclusion
We faced a number of constraints in setting up our data science platform due to the hard requirement of not using cloud-based solutions. However, since launch, and with ongoing iterations, it is proving instrumental in optimizing credit card authorization rates and helping to launch new products faster.
In the future, we look forward to building more unsupervised anomaly detection solutions and implementing generic ways to deploy ML to production.
If you found this post interesting, you can see me presenting on the topic Data Lineage in the Context of Interactive Analysis here:
Technical careers at Adyen
We are on the lookout for talented engineers and technical people to help us build the infrastructure of global commerce!
Check out developer vacancies