Tech stories
Injecting metadata as comments in our SQL queries: an “interesting” story
By Cosmin Octavian Pene, Java Engineer, Platform Scalability, Adyen

At Adyen we often encounter unexpected issues which are challenging to predict beforehand as is often the case when working with complex distributed systems.
In such systems even fairly, trivial changes could result in complex or puzzling behavior that we need to investigate. Since most of our engineers love puzzles and are quite intrigued by these problems, we like to call them “interesting” instead of “unexpected”.
This is a story about one of such problems; where our initial goal was to get more insights into our PostgreSQL logs by injecting metadata as comments. Along the way, we went through interesting challenges and learned more about the database internals and its driver.
What were we trying to achieve?
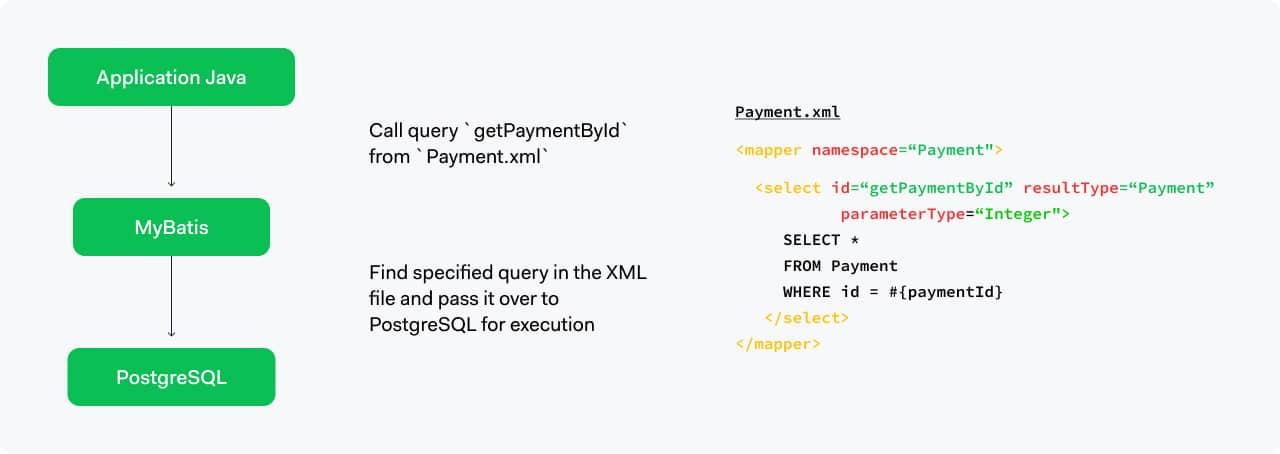
At Adyen we strive to use reliable and high-performant technologies which enable us to write simple, high-quality and performant code. For this reason, our current stack includes the well-known open-source relational databasePostgreSQL, together withMyBatis, an open-source persistence framework which supports custom SQL, stored procedures, advanced mappings, and programming-language-like control statements.
The way we use MyBatis is illustrated below:

We have thousands of queries and execute billions of them per day. So, sometimes it’s challenging to easily identify in the PostgreSQL logs which exact query was being executed. This is why we came up with the following idea:let’s programmatically inject “metadata” as comments for every query.
Since we are injecting metadata as comments, the PostgreSQL optimizer will ignore them during the execution, but the logs will give us insights into what is being executed.
The word “metadata” is intentionally ambiguous, and should allow developers to think of their own use case. For us, in the Platform Scalability team, it started with the MyBatis query mapper andid (Payment.getPaymentId).See illustration below:

This proved to be a great achievement already for various reasons: Not only did it make it possible to quickly identify a particular query in the logs (significantly helping with queries which need our immediate attention), but it also opened the gates to other developers to inject their own metadata to get more insights into their queries. This is exactly what happened!
Our colleagues from the Platform Observability team reached out to us to inject thetraceIdof a request. At Adyen, we use distributed tracing to track the whole flow of a request.
Simply put, atraceId helps with monitoring the whole lifecycle of a particular request. This is getting forwarded from the endpoint, across all service calls, and circling back until the response is returned. Later on, a developer can trace back a particular request and pinpoint the cause of an underlying issue. PostgreSQL was still one of those components seen as a black-box, tracing at the database level can turn out to be quite challenging.
So here is our improved query, containing even more metadata:

So far so good, we tested the change, pushed it to our test environments successfully and we were now ready to take this to production!
What actually happened…
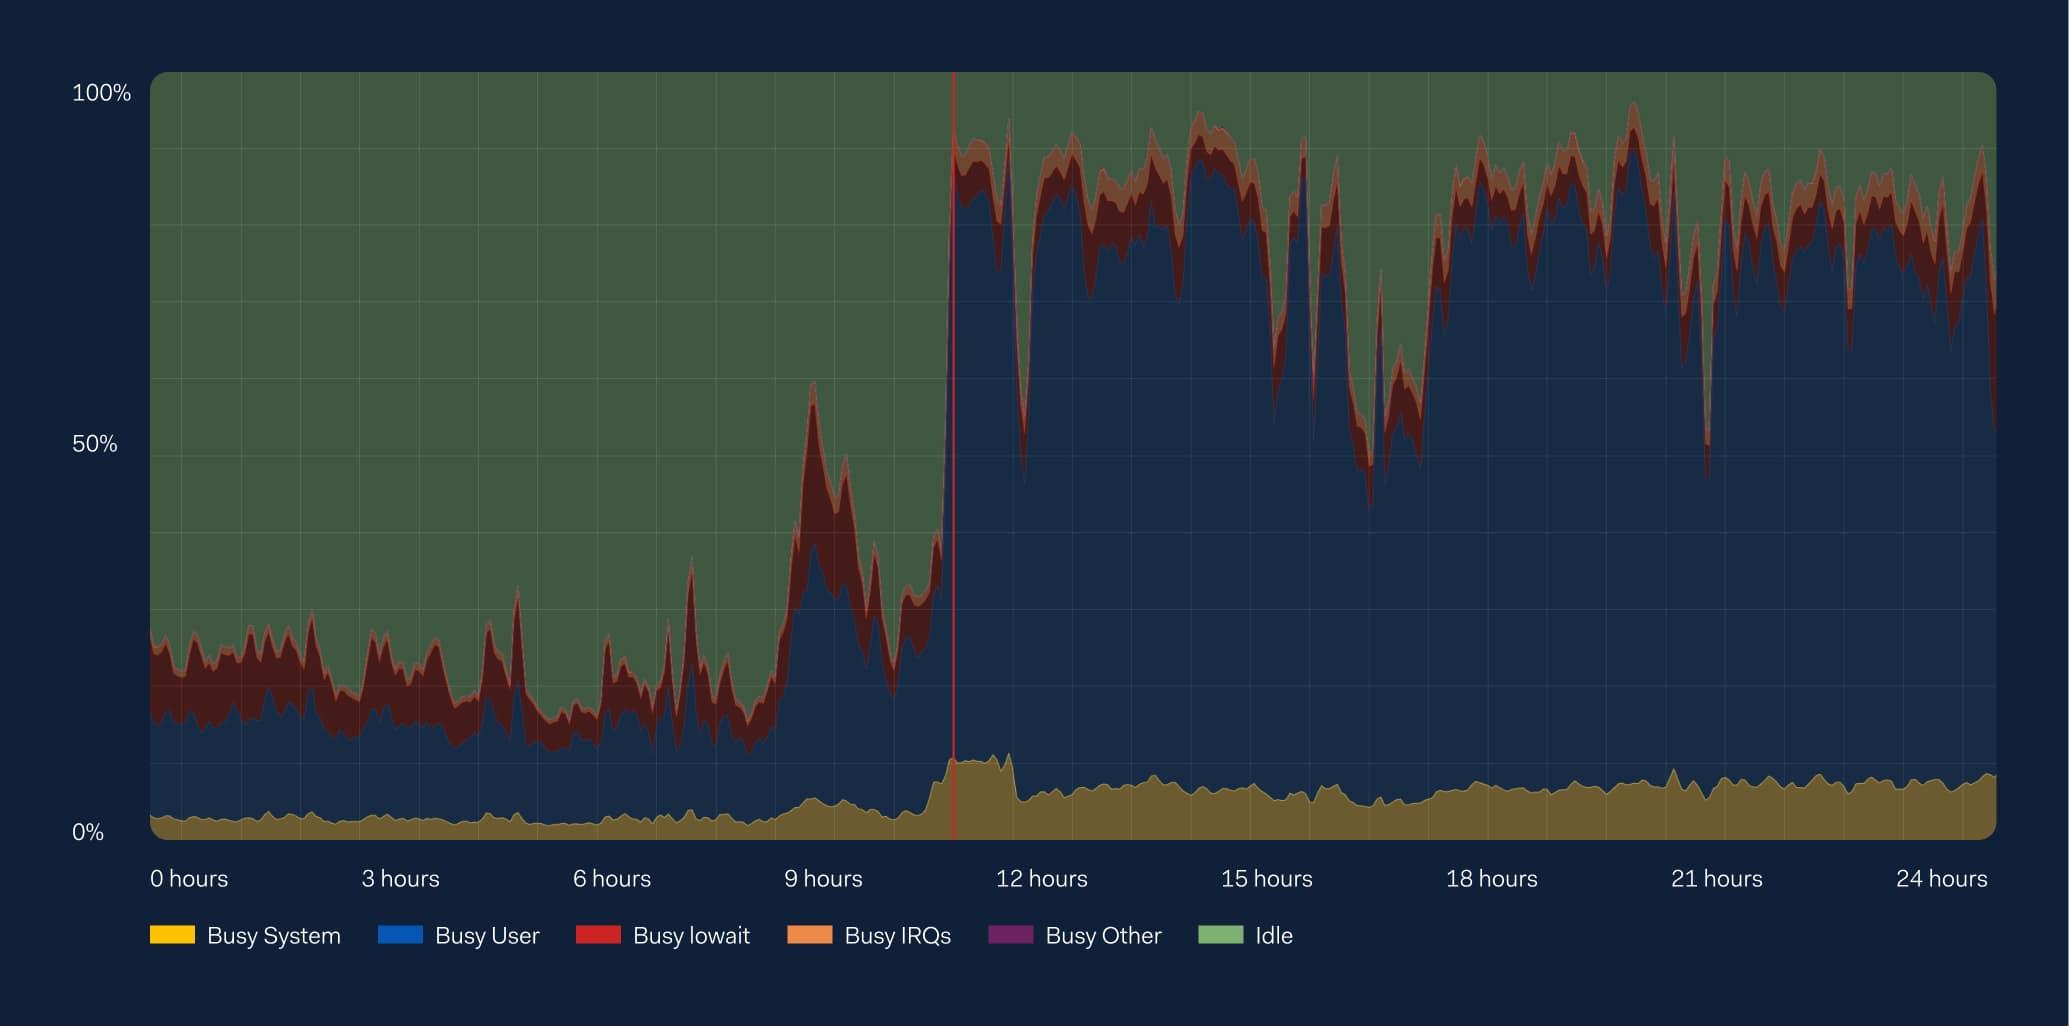
At the time of the release we saw a significant spike in CPU usage on our database servers.

It was quite difficult to assess whether our metadata injection was the actual problem; especially since we tested this on our test servers during the previous release and did not see anything similar. We eventually ran out of explanations and we switched off the feature. This led to the CPU usage slowly coming back to normal, giving everyone a bit of room to breathe after a thorough and stressful investigation. Thanks to our vigilant team of engineers and excellent monitoring, there was no merchant impact, and we kept processing payments as usual.
Now that everything was back to normal, we took a step back and investigated:
- We tested this on our database test servers before and saw no impact on the CPU load.
- There was little to no impact on the actual performance of the executed queries, but mostly high CPU usage.
- There was a much bigger increase on the database servers with a lot more traffic.
- We double checked the application code and verified we are not doing anything unusual.
- We even looked at the query plans and concluded that the PostgreSQL optimizer strips out the comments.
What caused the high CPU load? We were effectively only adding a few more bytes to each query executed on our servers. Could it be just that? As I mentioned, we execute billions of queries per day, so maybe adding a few more bytes to each query could make a difference.
Still, it didn't just sound right; we cannot conclude an investigation with mere guesses, and our engineers weren't satisfied with this explanation.
This is the classic trigger for an “interesting” problem here at Adyen. The more we run out of leads, the more our engineers come up with new ideas, leaving no stone unturned.
What was the underlying issue?
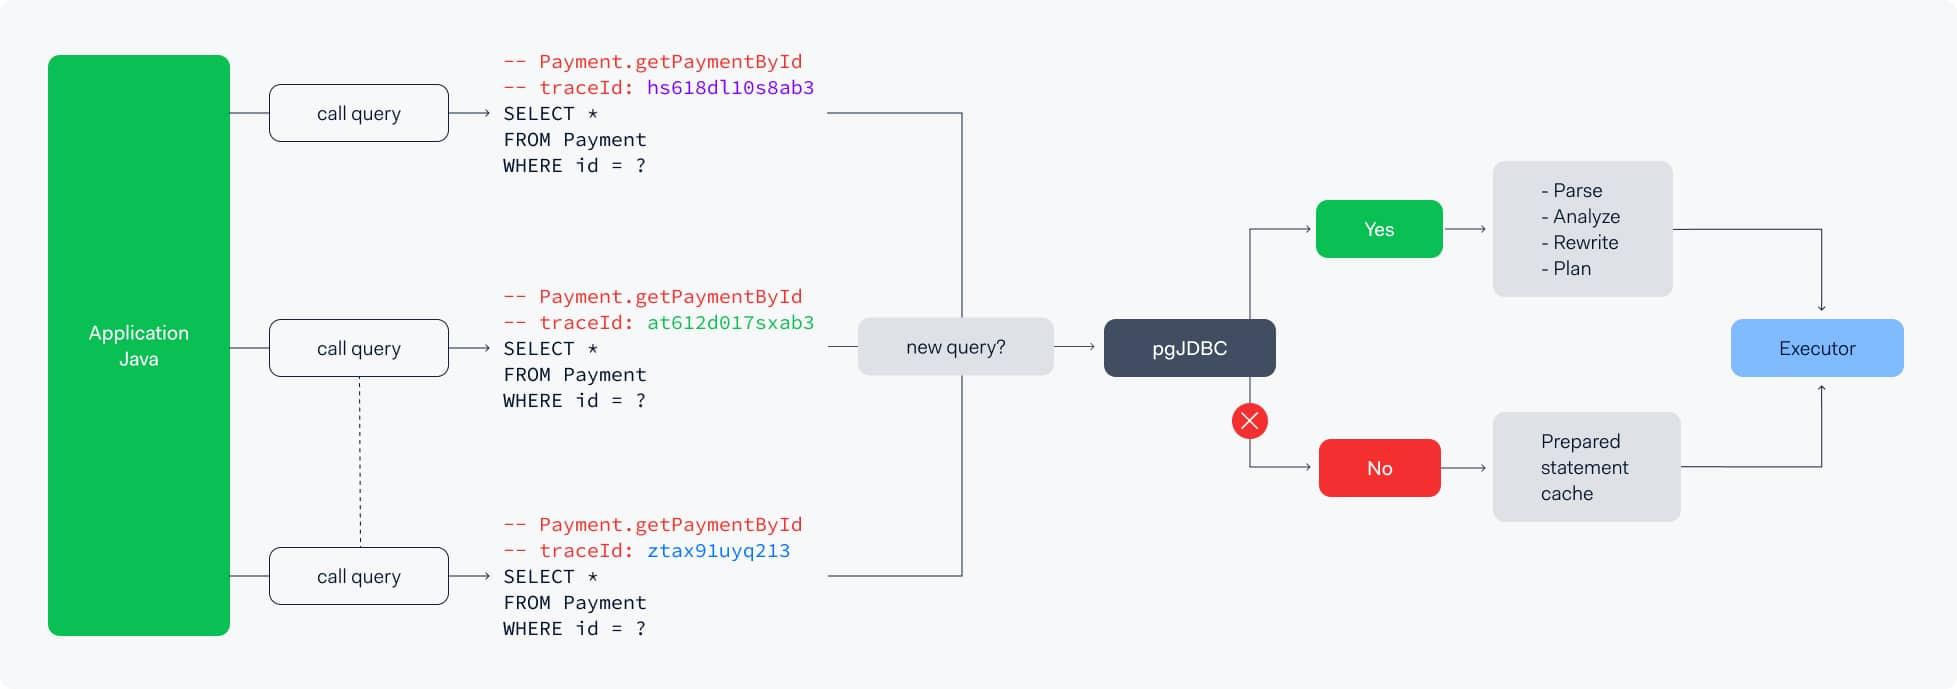
We started digging deeper into the source code of MyBatis. At the surface level there was nothing drawing our attention. Going one level deeper, we started looking at thePostgreSQL JDBC Driver (pgJDBC). MyBatis does not directly communicate with PostgreSQL, it communicates through the Java Database Connectivity driver. The driver offers a public Java API to connect and communicate with the database. See illustration below:

Taking a closer look in the driver’s documentation we came across theServer Prepared Statementssection. To understand what prepared statements are, let’s take a look atthe official PostgreSQL documentation:
“ref
A prepared statement is a server-side object that can be used to optimize performance. When the PREPARE statement is executed, the specified statement is parsed, analyzed, and rewritten. When an EXECUTE command is subsequently issued, the prepared statement is planned and executed. This division of labor avoids repetitive parse analysis work, while allowing the execution plan to depend on the specific parameter values supplied.
"
So, prepared statements can be used for queries that are executedmany timesto skip a few steps (such as parsing and planning) and directly get to the execution phase. The diagram below illustrates this:

So how does pgJDBC use server side prepared statements? As per their officialdocumentation:
“ref
Server side prepared statements can improve execution speed as
- It sends just statement handle (e.g. s_1) instead of full SQL text.
- It enables use of binary transfer (e.g. binary int4, binary timestamps etc.); the parameters. and results are much faster to parse
- It enables the reuse server-side execution plan.
- The client can reuse result set column definition, so it does not have to receive and parse. metadata on each execution.
"
The first one is an interesting point. Not only does sending the statement handle instead of the full SQL lead to less network traffic, but it also leads to much less CPU overhead since there is no need to parse the query anymore.
When does pgJDBC decide to use prepared statements? By default, it uses a threshold of 5:
“ref
An internal counter keeps track of how many times the statement has been executed and when it reaches theprepareThreshold(default 5) the driver will switch to creating a named statement and usingPrepareandExecute.
"
🤔 Could it be that pgJDBC v42.2.26 does not prepare the statements anymore, leading to parsing and planning every single query over and over again, therefore leading to high server CPU usage?
We already verified that comments are stripped out when PostgreSQL parses the query. Shouldn’t there be a shared logic between PostgreSQL and its driver?
❗No, apparently not. Looking atQueryExecutorBaseclass, we noticed the prepared statements cache is implemented using aLeast Recently Used (LRU)cache and using anObjectas the key:
private final LruCache<Object, CachedQuery> statementCache;
How is this key created? Well, it seems thekeyis the SQL query itself:
      @Override
  public final Object createQueryKey(String sql, boolean escapeProcessing,
      boolean isParameterized, String @Nullable ... columnNames) {
    Object key;
    if (columnNames == null || columnNames.length != 0) {
      // Null means "return whatever sensible columns are" (e.g. primary key, or serial, or something like that)
      key = new QueryWithReturningColumnsKey(sql, isParameterized, escapeProcessing, columnNames);
    } else if (isParameterized) {
      // If no generated columns requested, just use the SQL as a cache key
      key = sql;
    } else {
      key = new BaseQueryKey(sql, false, escapeProcessing);
    }
    return key;
  }
So, at the driver level, there is no parsing or stripping out comments for the prepared statements cache. After all, the only thing that should change in a prepared statement query are the parameters, which are replaced by “? ” symbol in a parameterized query.
But wait, what were we doing wrong? We were prepending the source of the query, which is always the same, and also prepending thetraceIdof the request, which is…
💡… NOT the same across requests! It is a dynamic metadata. By receiving a differenttraceIdfor each request, the pgJDBC is tricked into thinking it receives a different query every time. Therefore, we never reach the defaultprepareThreshold, which is 5, and we never trigger a prepared statement.
So we go through all the extra steps explained above (parsing, analyzing, rewriting, and planning) every single time, which you can imagine, for billions of queries a day, puts a heavy load on our database servers, leading to very high CPU usage.

Solution and Lessons
🏁 We removed thetraceIdfrom the metadata, performed some tests locally, did some more tests on our database test servers, tested on our production serversgraduallyacross our data centers, and we finally confirmed thetraceIdwas the actual problem!
We now have static metadata injected in our queries as comments, with no performance degradation or CPU overhead.
During this “interesting” incident we got to dive deep into the pgJDBC code, learning more about the server side prepared statements cache. In our case this meant:
- static metadata is safe to inject and we can keep enhancing this feature further if we want to
- dynamic metadata will break the internal driver prepared statements cache, leading to CPU overhead and performance degradation in the total execution time of the queries.
Conclusion
Retrospecting over the whole incident, there are a few very important lessons to keep in mind.
Firstly, any change, however small it may look like, can have drastic impact over the whole platform, especially here at Adyen where we work at large-scale. While prepending a few lines of comments to the SQL query does not sound like a performance concern, there might be multiple “interesting” problems along the way.
Secondly, we could have tested the new functionality gradually across our data centers for example. In the scale we operate, even small details can cause a huge impact, and the tests we do along the way might still not be enough.
Finally, we could have tested features separately. If we would have tested only the MyBatis query source first, we would have known immediately thetraceIdis an (isolated) problem and would have probably shifted our initial discussions and led to finding the cause even faster.
In the end, this was an “interesting” story with challenges and lessons along the way. If it wasn’t for our curious engineers, we wouldn’t have so many stories to tell, but a pile of mysteries and abandoned features.