Tech stories
Tracking HOT updates and tuning FillFactor with Prometheus and Grafana
by Derk van Veen & Dave Pitts, DBAs, Adyen

This blogpost is a sequel to the formerblog post where we detail how we were able to mitigate Postgres’ write amplification challenge with HOT updates at Adyen.
In this post, we highlight how we have been able totrack HOT updates and tune Fillfactor with Prometheus and Grafana.
Intro
We track HOT updates by tracking the `pg_stat_user_tables` with Prometheus and Grafana. First, before jumping into how we track this, let’s recap a few key points on why write amplification happens and HOT updates can mitigate it:
- A single row regular update for a table with 10 indexes would involve 11 block changes - 1 for the new table block and another 10 for the indexes (one per index). This results in a high write amplification.
- A single row regular update for a table with 20 indexes would involve 21 block changes, 1 for the new table block and another 20 for the indexes (one per index). This results in an even higher write amplification.
- A single row HOT update for a table with 10 indexes would involve just 1 block change, 1 for the new table block and zero for the indexes. Here, no write amplification occurs.
- A single row HOT update for a table with 20 indexes would involve just 1 block change, 1 for the new table block and zero for the indexes. Here, also, no write amplification occurs
- Postgres will perform a HOT UPDATE only if: a) Absolutely no indexed columns are updated AND b) There is free space in the current block (which largely depends on the FillFactor and limiting Long Running Queries/Long Running Transactions).
Metrics from the Prometheus Postgres Exporter
With these background rules in mind, let's start looking at a few key metrics from the Prometheus Postgres exporter:
Polling `pg_stat_user_tables` (every 5 minutes)
- TOTAL rows count
- INSERT rows count
- UPDATE row counts (HOT or not)
- DEAD row count
We also discuss the following graphs on thisYouTuberecording (starting at 19:30)
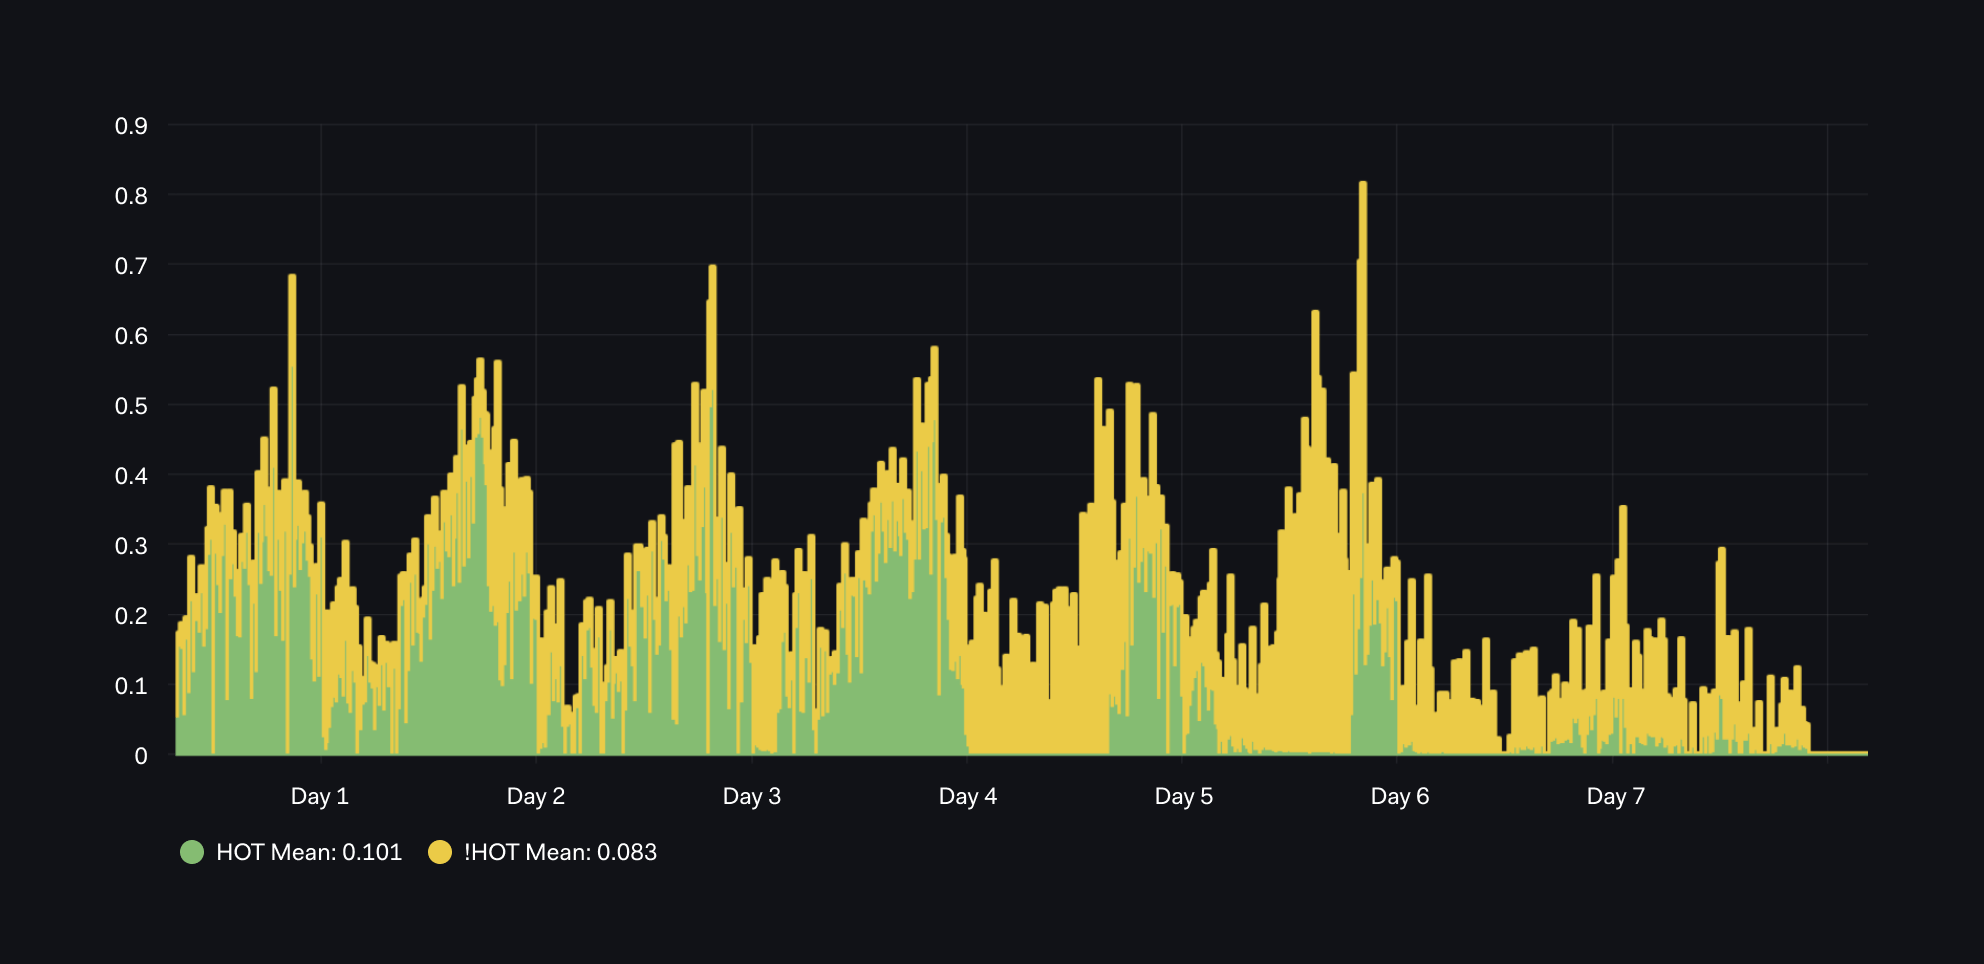
Graph 01 - UPDATEs HOT or not?
Our first graph below is based on the five(5) minutes deltas or differences between:
- The total number of HOT updates on `pg_stat_user_tables_n_tup_hot_upd` and
- The total number of HOT updates on `pg_stat_user_tables_n_tup_upd`
QUERY BLOCK
HOT updates
    delta(
 pg_stat_user_tables_n_tup_hot_upd
 { realhostname="$hostname",
  datname="$dbname",
  schemaname="$schemaname",
  relname="$relname"
 }[5m])
Regular Update
    delta(
 pg_stat_user_tables_n_tup_upd
 {
   realhostname="$hostname",
   datname="$dbname",
   schemaname="$schemaname",
   relname="$relname"
 }[5m])
-delta(
 pg_stat_user_tables_n_tup_hot_upd
 {
    realhostname="$hostname",
    datname="$dbname",
    schemaname="$schemaname",
    relname="$relname"
  }[5m])
From the graph, we can interpret that:
- We had a good rate of HOT Updates up to Day 4.
- After Day 4, there were some severe performance issues with a very large number of non-HOT updates.
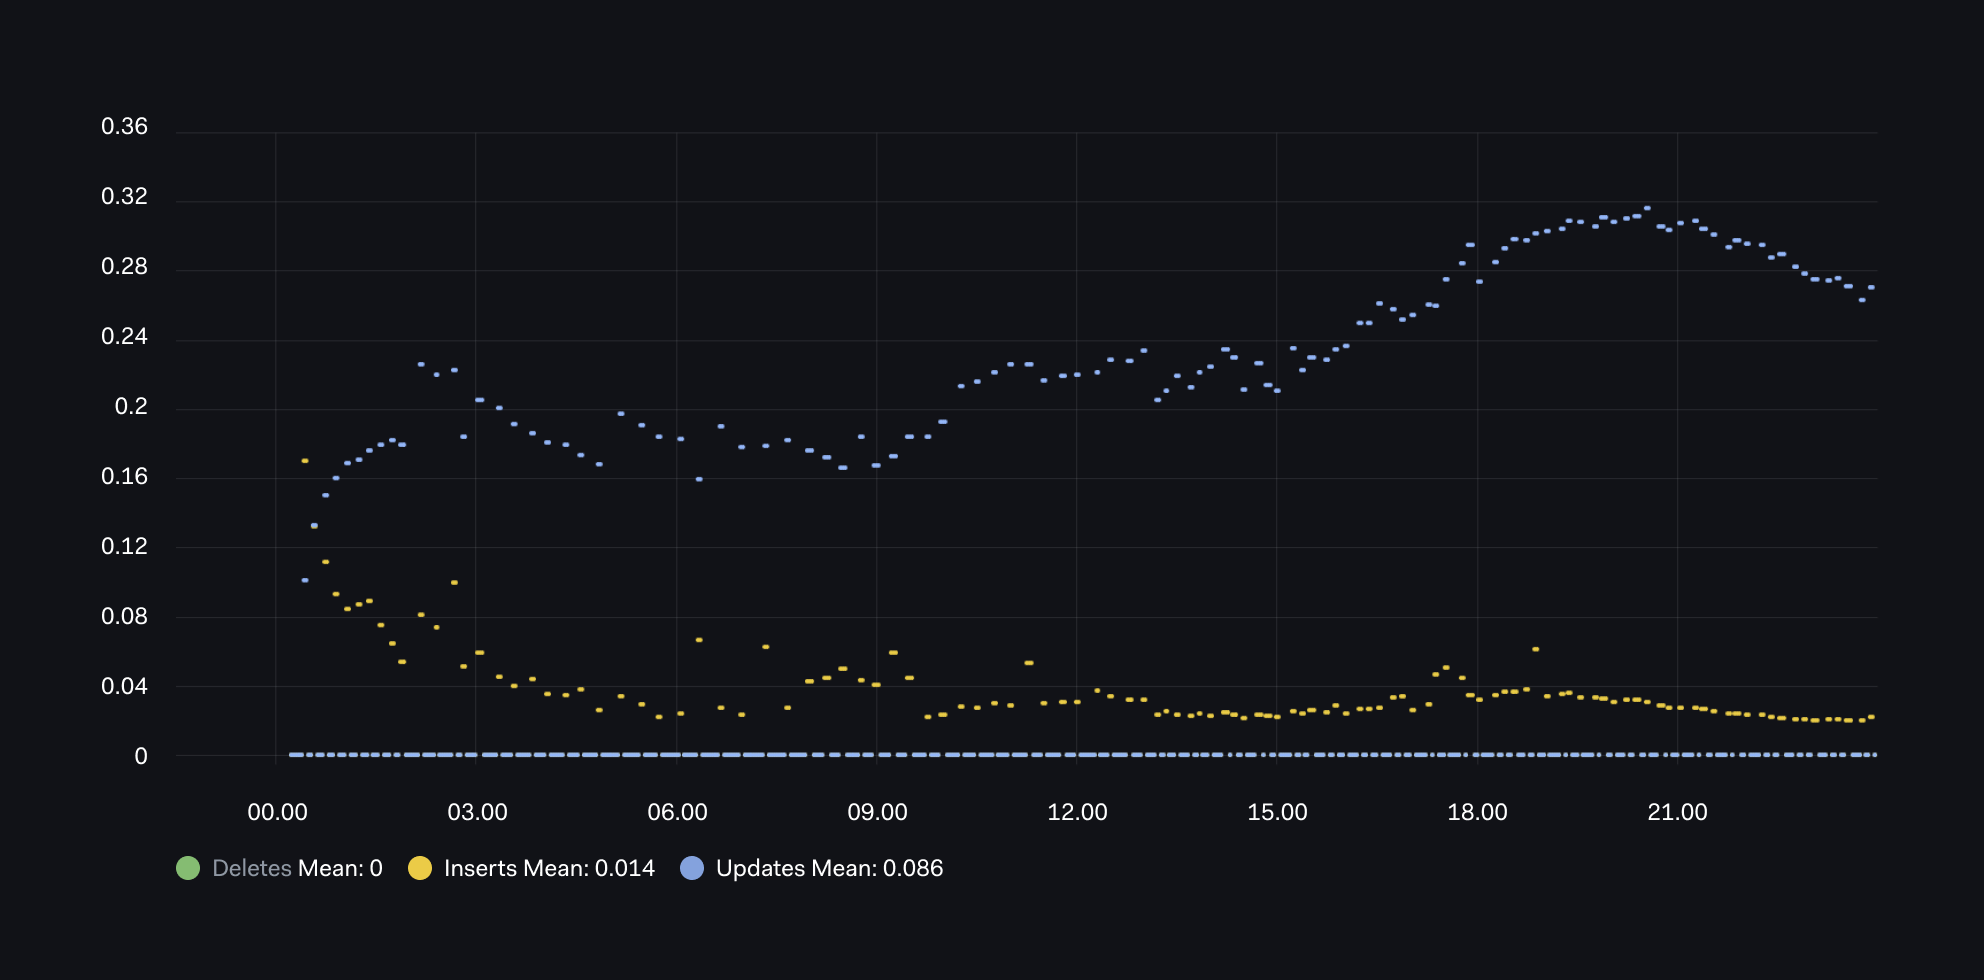
Graph 02 - Updates vs Inserts vs Deletes
Typically, write amplification occurs around frequently updated tables.
Our next graph is based on the 15 minutes deltas of:
- The total number of inserts for `pg_stat_user_tables_n_tup_ins`
- The total number of updates for `pg_stat_user_tables_n_tup_upd`
- The total number of deletes for `pg_stat_user_tables_n_tup_upd`
QUERY BLOCK
Inserts
    delta(
 pg_stat_user_tables_n_tup_ins
 {
   realhostname="$hostname",
   datname="$dbname",
   schemaname="$schemaname",
   relname="$relname"
 }[15m]
)
Updates
    delta(
 pg_stat_user_tables_n_tup_upd
 {
   realhostname="$hostname",
   datname="$dbname",
   schemaname="$schemaname",
   relname="$relname"
 }[15m]
)
Deletes
    delta(
 pg_stat_user_tables_n_tup_del
 {
   realhostname="$hostname",
   datname="$dbname",
   schemaname="$schemaname",
   relname="$relname"
 }[15m]
)
From this graph, we can interpret that over this day, there is a pattern with initially high inserts (yellow), but this is soon dominated by updates(blue) and no deletes.
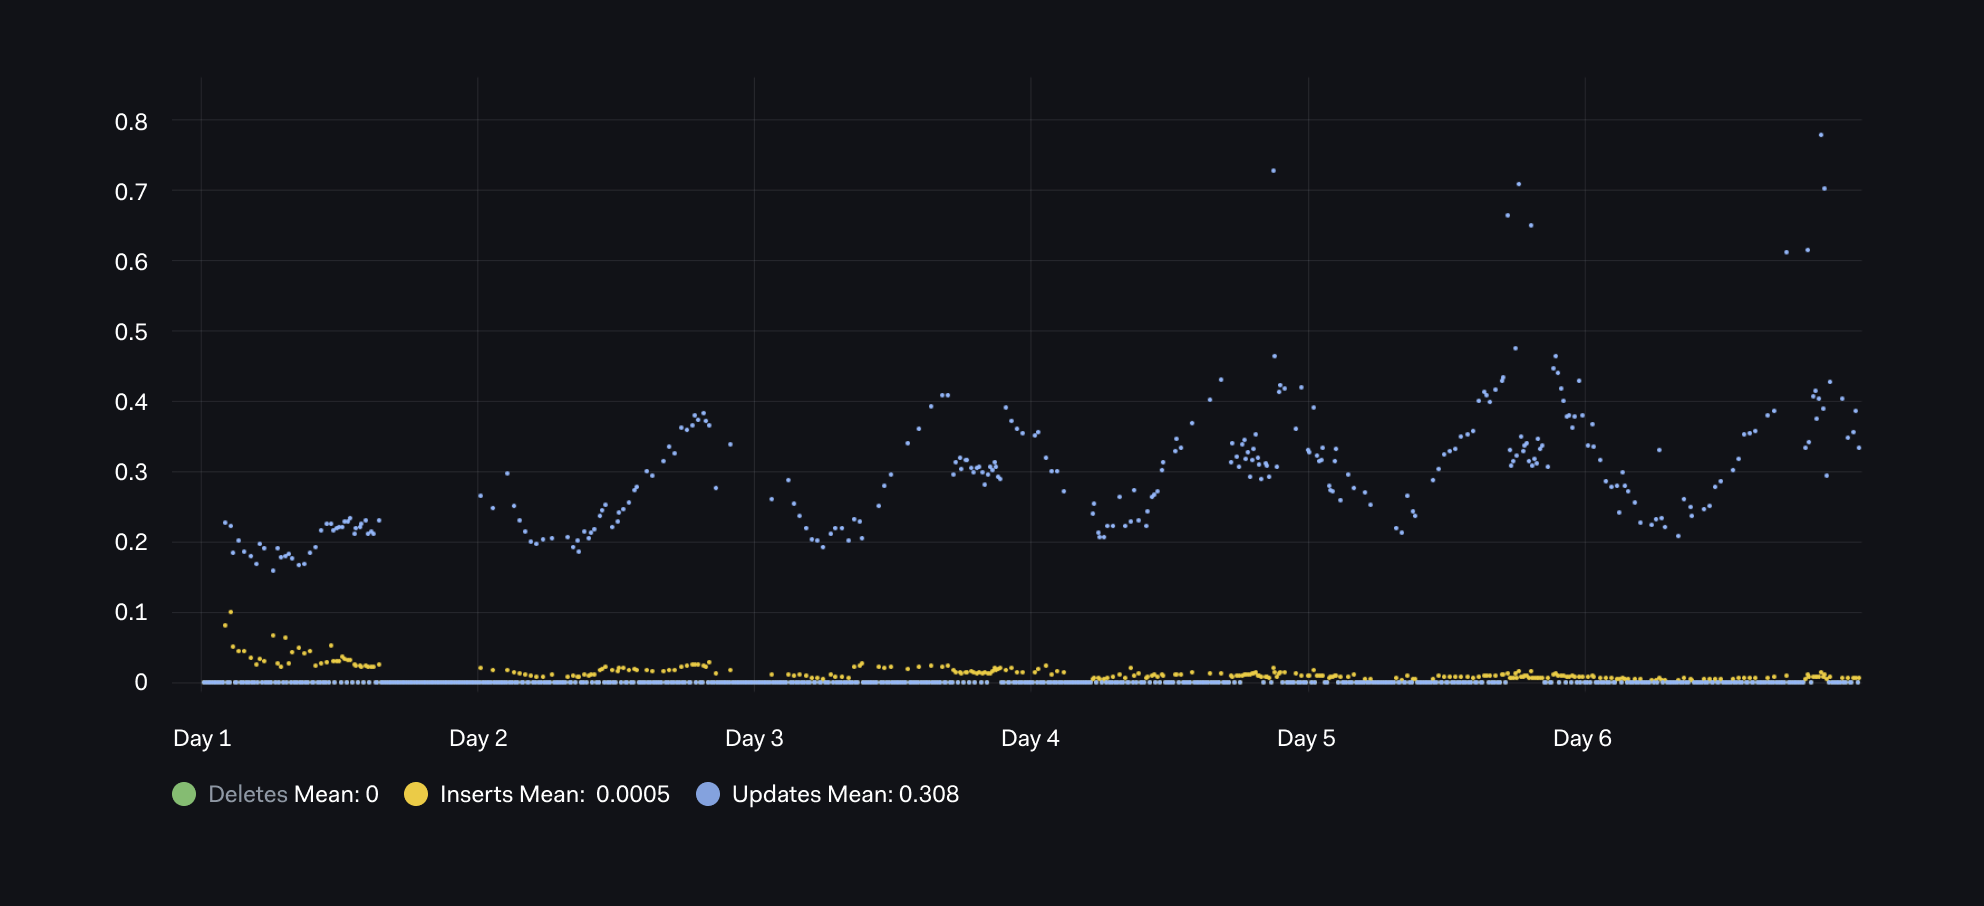
Also, we can see this pattern of UPDATEs dominating INSERTs over the following week:
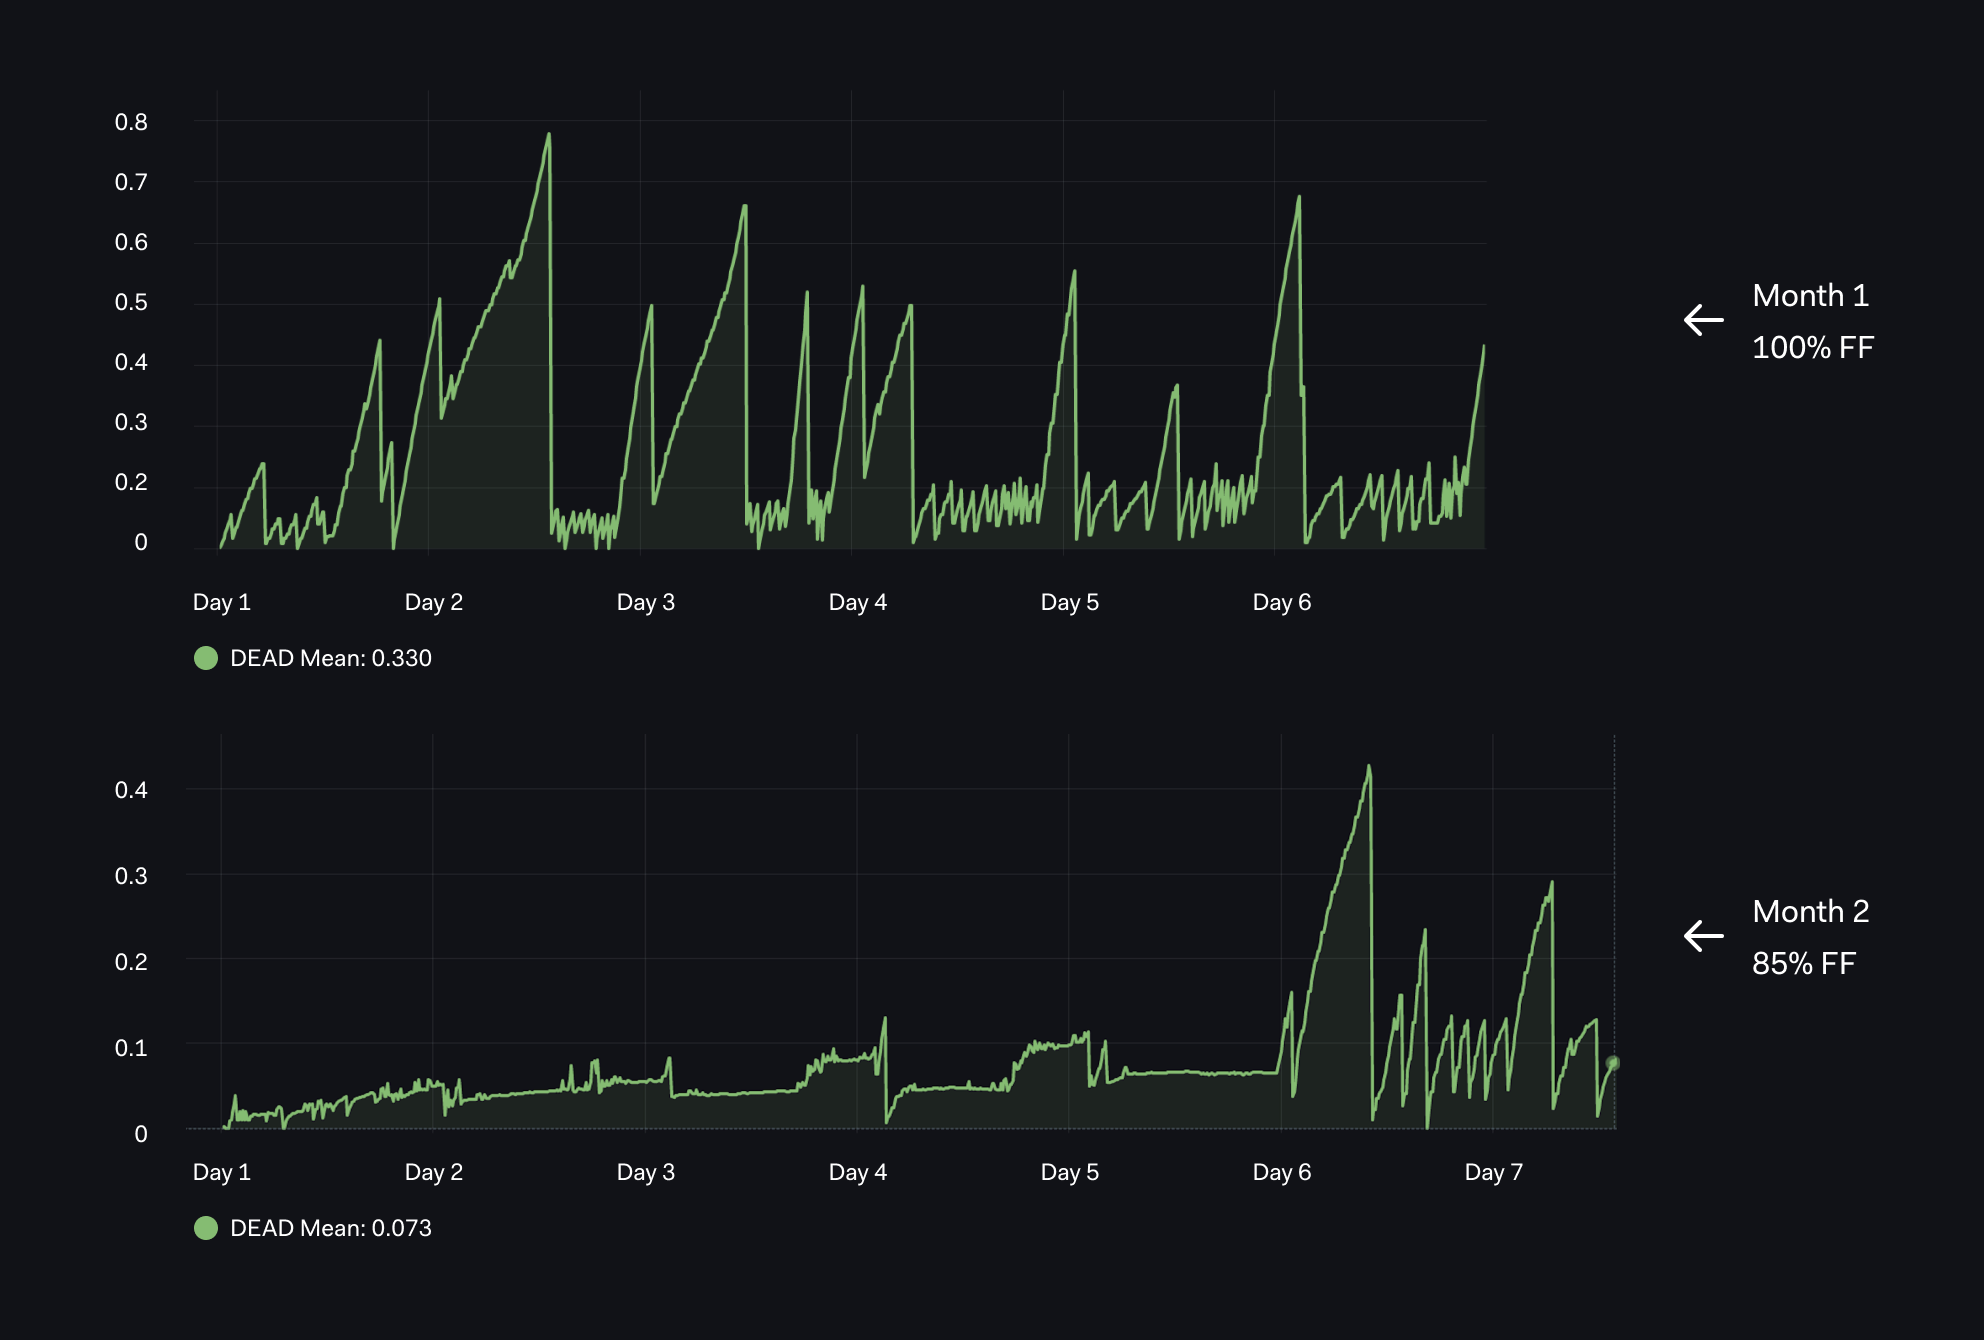
Graph 03 - Tracking Dead Rows with Different FillFactors
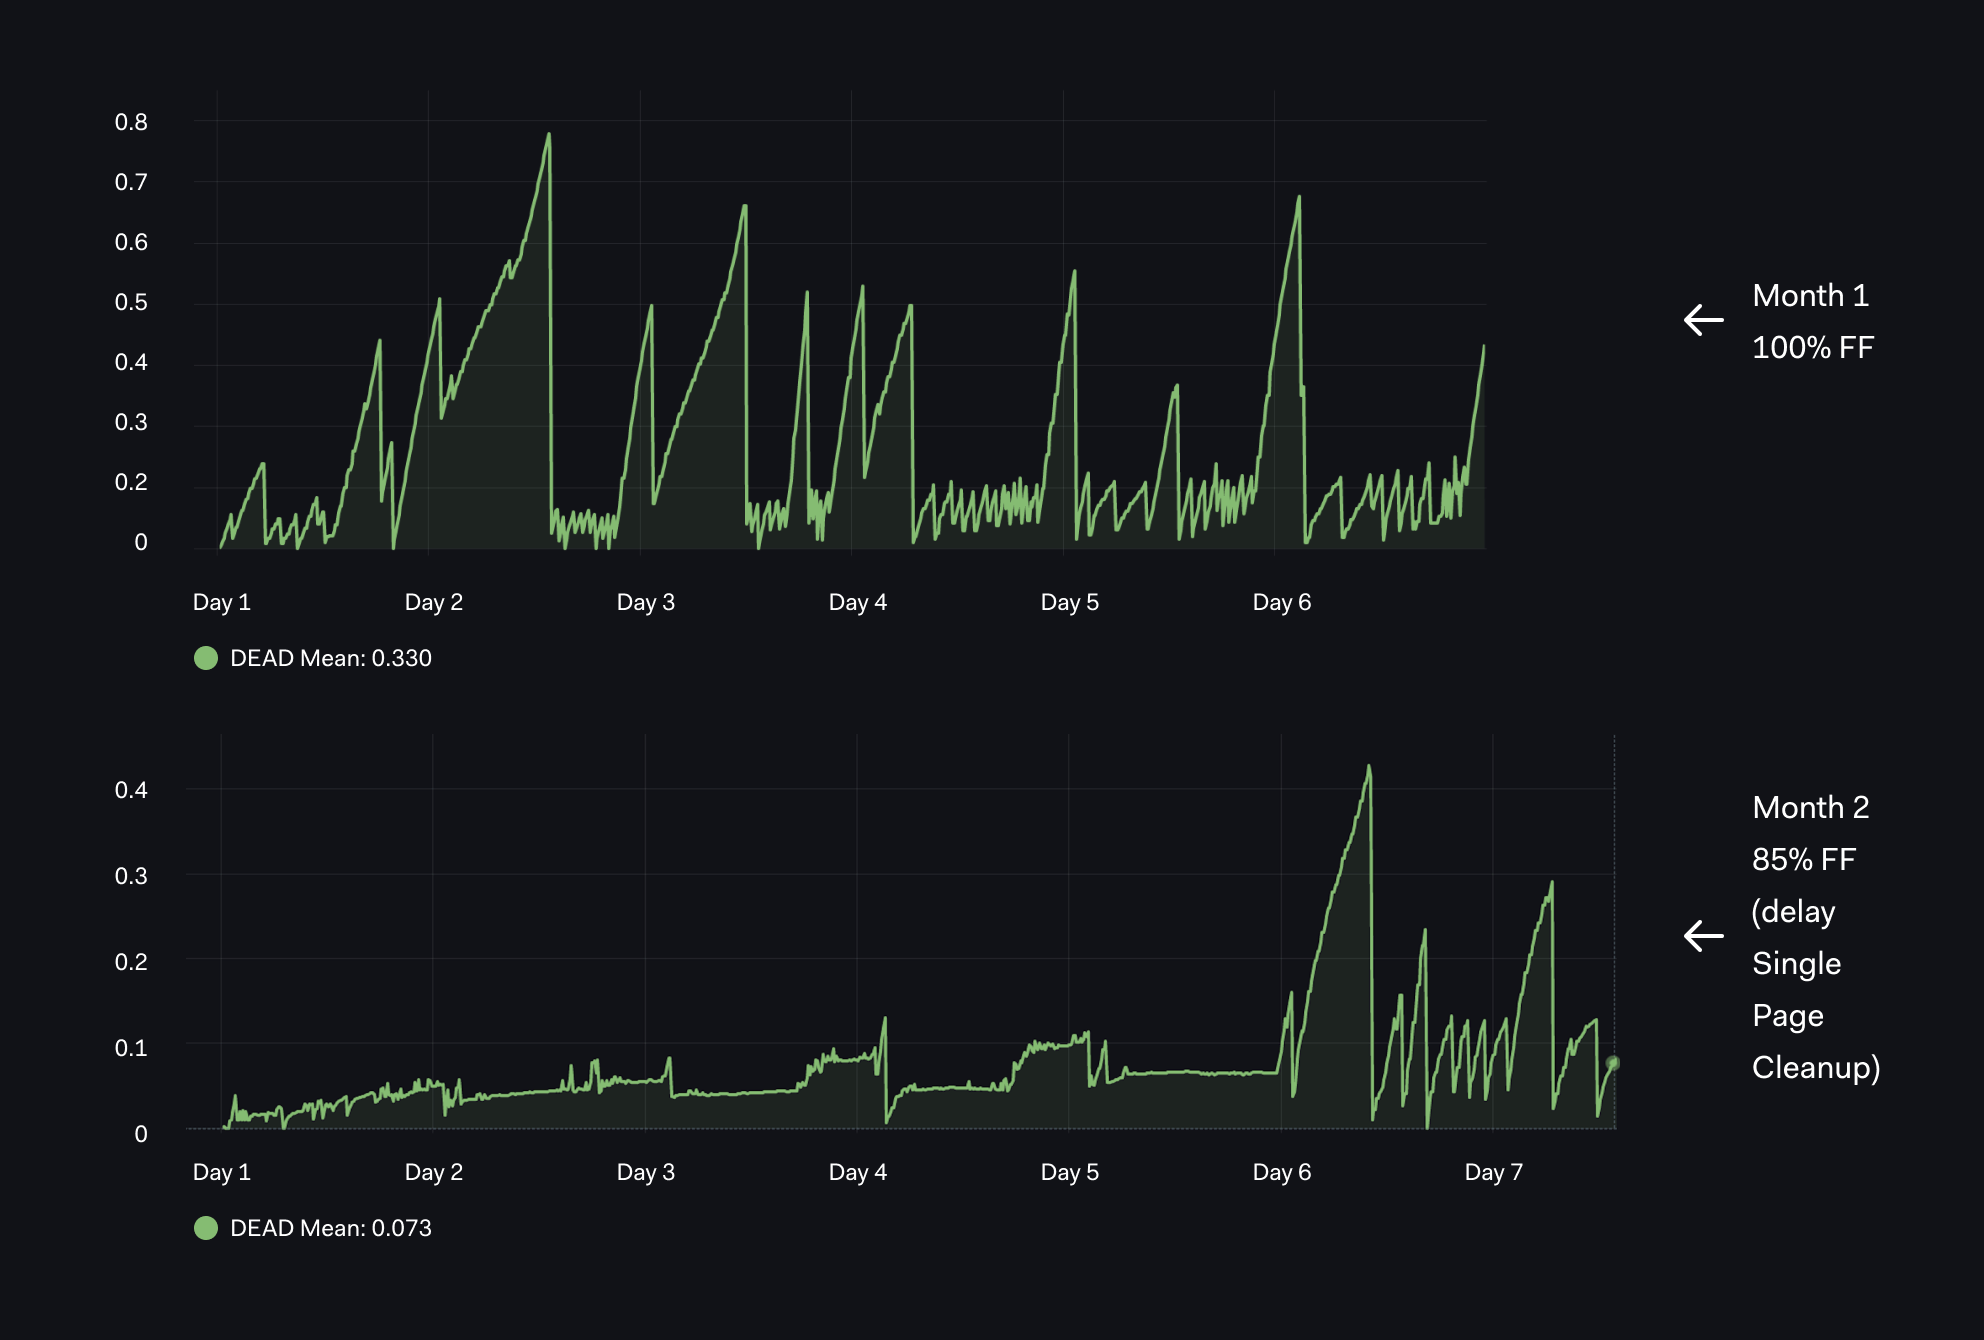
Our next graph is based on the total number of dead rows - `pg_stat_user_tables_n_dead_tup`:
QUERY BLOCK
Dead Row
    pg_stat_user_tables_n_dead_tup
 {
  realhostname="$hostname",
  datname="$dbname",
  schemaname="$schemaname",
  relname="$relname"
 }
From the graph, we can interpret that:
- In the first month, with default 100% FF(FillFactor), we have pretty extreme Dead Rows with rapid spikes up to 0.6 - 0.8 multiple times over the first week.
- In the next month(lower graph), with 85% FF, we have much less Dead Rows that grow very slowly due to lower fill factor. Then something happens on day 6 of the month - long running transactions delay dead row cleanup.
Graph 04 - Tracking WAL (Write Ahead Logs) generation
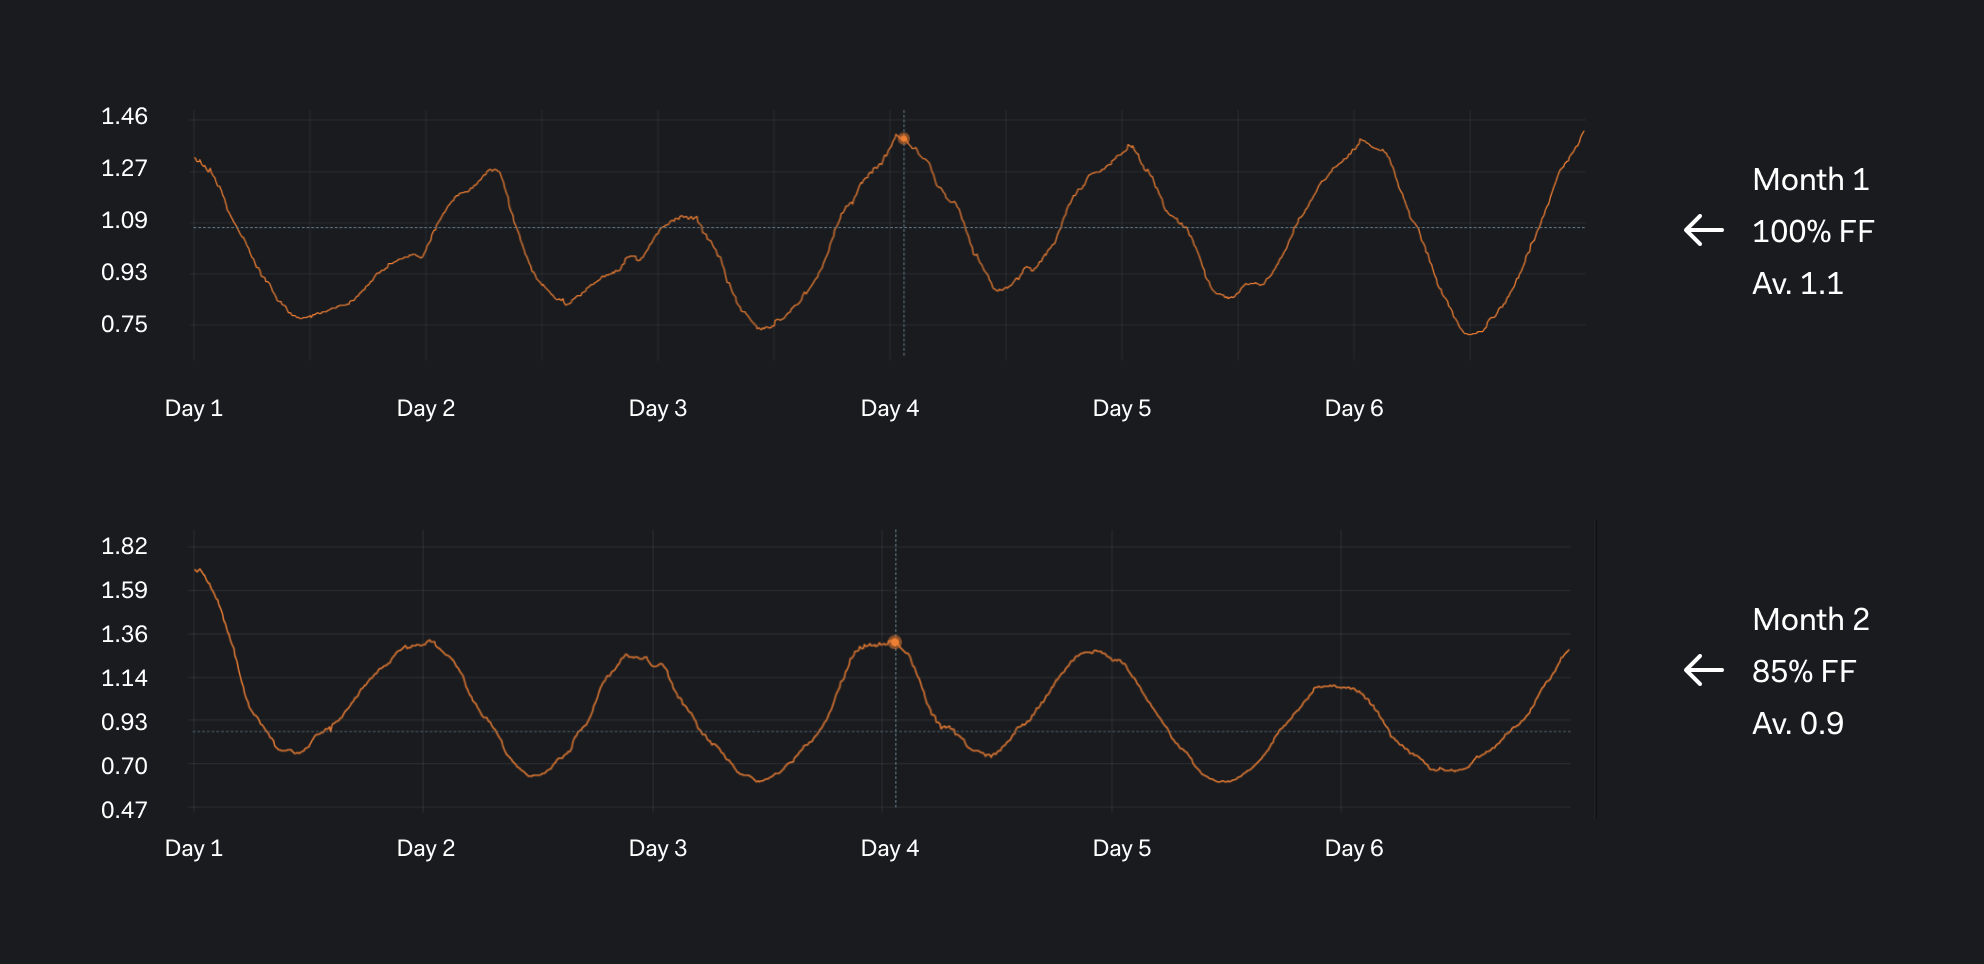
Our next graph is based on the size of pg_xlog (contains Postgres WAL) which we track over a rolling eight(8) hour window.
    pg_xlog_position_bytes
 {clustername="$clustername",
 server="<PATH TO WAL folder>"}
WAL Generation
    delta(pg_xlog_position_bytes
{clustername="$clustername",
 server="<PATH TO WAL folder>"}[8h])
 }
The key things to highlight here:
- In the first month, with default 100% FF, we average about 1.1, every 8 hours.
- In the next month with custom 85% FF, we average about 0.9, every 8 hours.
i.e. nearly a 20% saving! Not just once, we keep multiple copies of the WAL files plus, of course, backups of these WAL files!
Note: Our prometheus exporter `pg_xlog_position` is now based on `pg_current_wal_lsn` which has replaced `pg_current_xlog_location`: https://github.com/prometheus-community/postgres_exporter/issues/495
Graph 05 - Table and Index Sizing
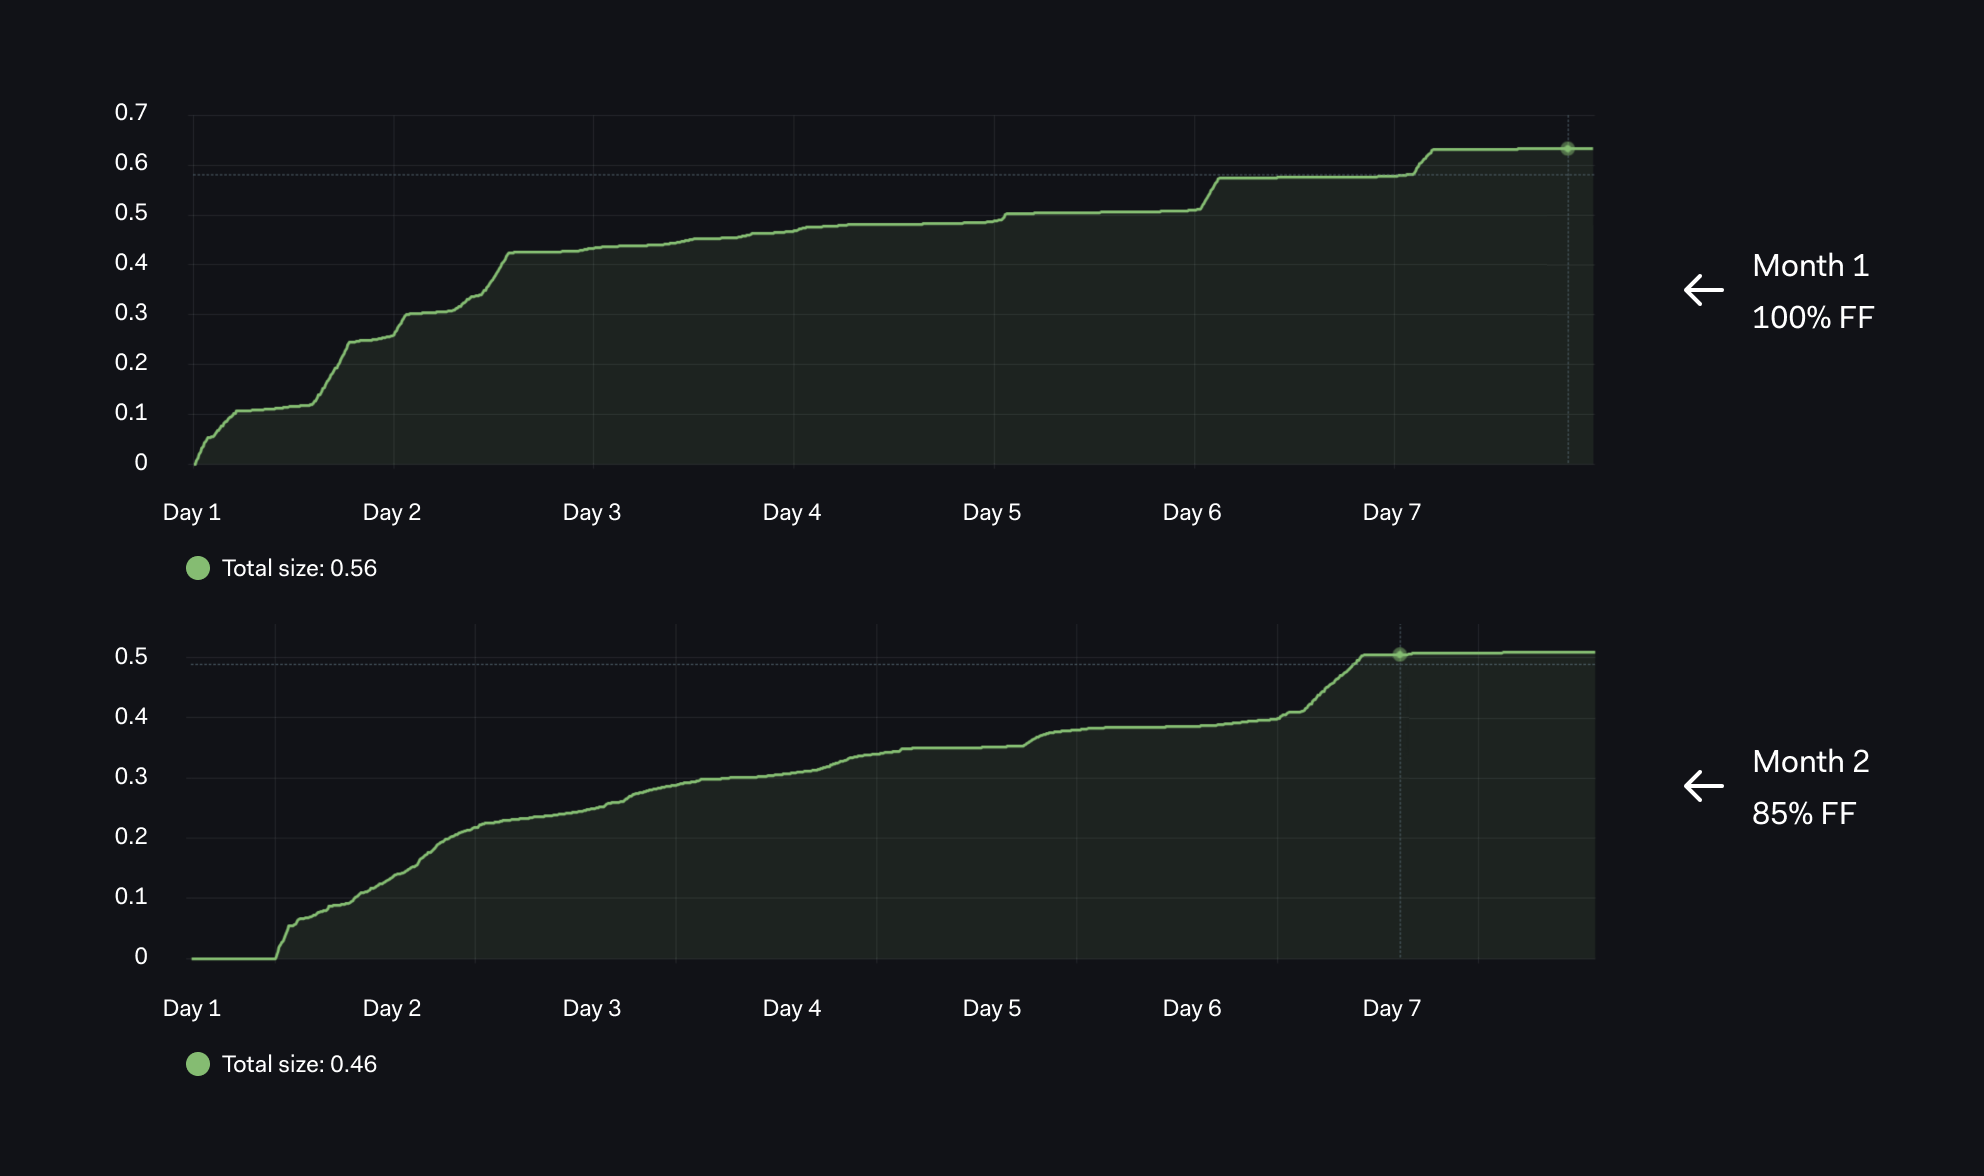
Our next graph is based on the combined size of the table `pg_relation_size_table` and related indexes `pg_relation_size_table`.
By running with a low fill factor where each block was created with 15% unused space - 85% FF, we were expecting a larger table and larger storage overhead, but the total size (table and index) was significantly lower. We had up to 0.56 with 100% and 0.46 with 85%!
QUERY BLOCK
Combined pg_relation_size_table and pg_relation_size_indexes
    pg_relation_size_indexes
{
 realhostname = "$hostname",
 datname = "$dbname",
 schemaname="$schemaname",
 relname="$relname"
}
+
pg_relation_size_table
{
 realhostname = "$hostname",
 datname = "$dbname",
 schemaname="$schemaname",
 relname="$relname"
}
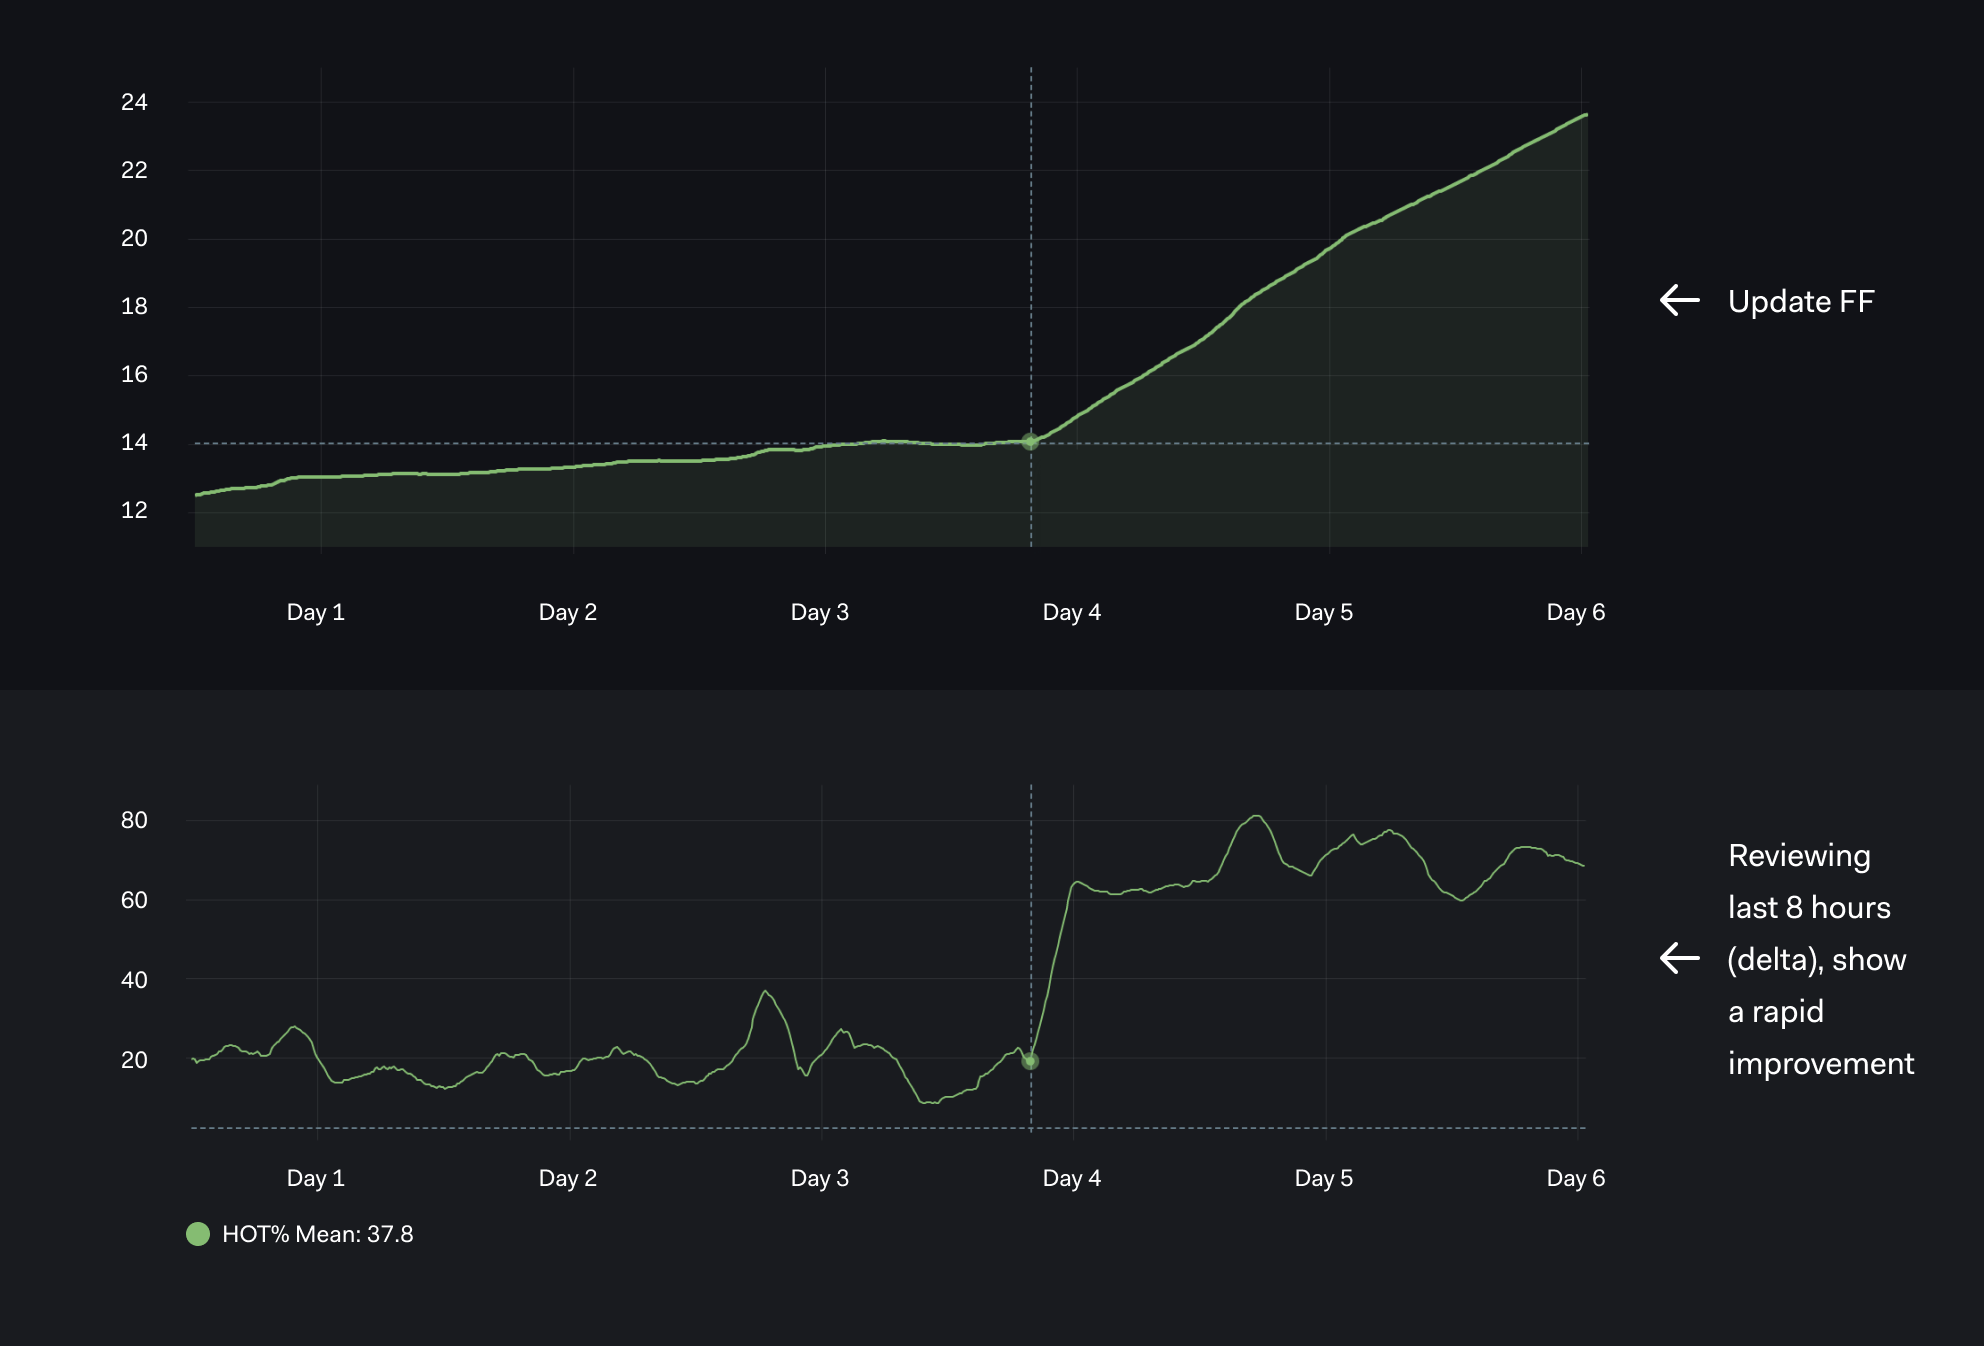
Graph 06 - Last 8 hour (delta) HOT Updates up from 20% to 70%
Our next graph shows the difference between
- (a) the cumulative HOT updates and
- (b) last 8 hour (delta) HOT Updates.
The effect of reducing the FF from 100% to 80% around between day 3 and day 4 is much clearer with the DELTA based chart.
QUERY BLOCK
Using 100 * pg_stat_user_tables_n_tup_hot_upd/pg_stat_user_tables_n_tup_upd but combined with delta(8h)
    100*delta(
 pg_stat_user_tables_n_tup_hot_upd
 {
   realhostname="$hostname",
   datname="$dbname",
   schemaname="$schemaname",
   relname="$relname"
 }[8h]
 )
 /delta(
  pg_stat_user_tables_n_tup_upd
  {
    realhostname="$hostname",
    datname="$dbname",
    schemaname="$schemaname",
    relname="$relname"
  }[8h]
  )
Long Running Transactions/Queries (LQTs/LRQs)
It is the responsibility of Database Architects (DBAs) to warn Developers about the dangers of Long Running Queries/Transactions.
However, unless the developers can tangibly see the effect of their LRQ, they are likely to overlook or even forget this important advice. Also how do the developers know ahead when their code is going to hit an edge case and trigger LRQs?
The nice thing with our new dashboards is that thedevelopers can see the impact of problemslike this, just like on day 6 shown below and then we can start breaking it down.
Here is some of the awesome feedback from one of our development teams:
- “One of the most important lessons learned was LRQs.”
- “Massive impact on DB performance.”
Faster Jobs
After the first FF & HOT update internal presentation at Adyen and rolling out the new dashboards, we were asked to review a background process which was taking too long.
This particular development team had been trying to understand inconsistent job performance for a very long time. They had checked dozens of metrics in the application and infrastructure layers, and had found no obvious clues based on CPU, IO and/or network load in the application or database. The only correlation was this “typically ran slow particularly after large batch INSERTs”?
Fortunately, the new dashboard clearly showed there would be significant gains with a lower FillFactor. We got an immediate 30% time saving by simply reducing FF on the existing table (non partitioned). Since then, the dev team have also refactored logic, reduced LRQs and now the key job is four(4) times faster!
So, we started with an easy win by tuning the FillFactor and then got an even bigger win by breaking down some long running transactions and getting even closer to 100% HOT Updates.
Conclusions
We had some very nice results from tuning FillFactor and we have some fancy graphics to show this, but that's not our main point yet. The bigger win here is that we have a Prometheus/Grafana dashboard which allows various development teams to track the performance of their key tables.
Since giving the first version of this presentation about a couple of months ago, multiple development teams have proactively come with tables which we need to tune either by adjusting FillFactor and/or by tackling very Long Running Transactions.
Finally, it is important to note that there are always exceptional cases. For example, in one case where we needed to heavily update an indexed column, it was good to follow strict normalization rules. We broke down tables with a large number of columns into smaller tables; hence less columns and less indexes.
If you only have one index on a table, even a regular, non-HOT update will only involve two block updates for damage control. However, most of the time, we can optimize our processes to achieve close to 100% HOT updates. This is a great target for our development teams who are definitely up for this challenge!